
Figure 7.
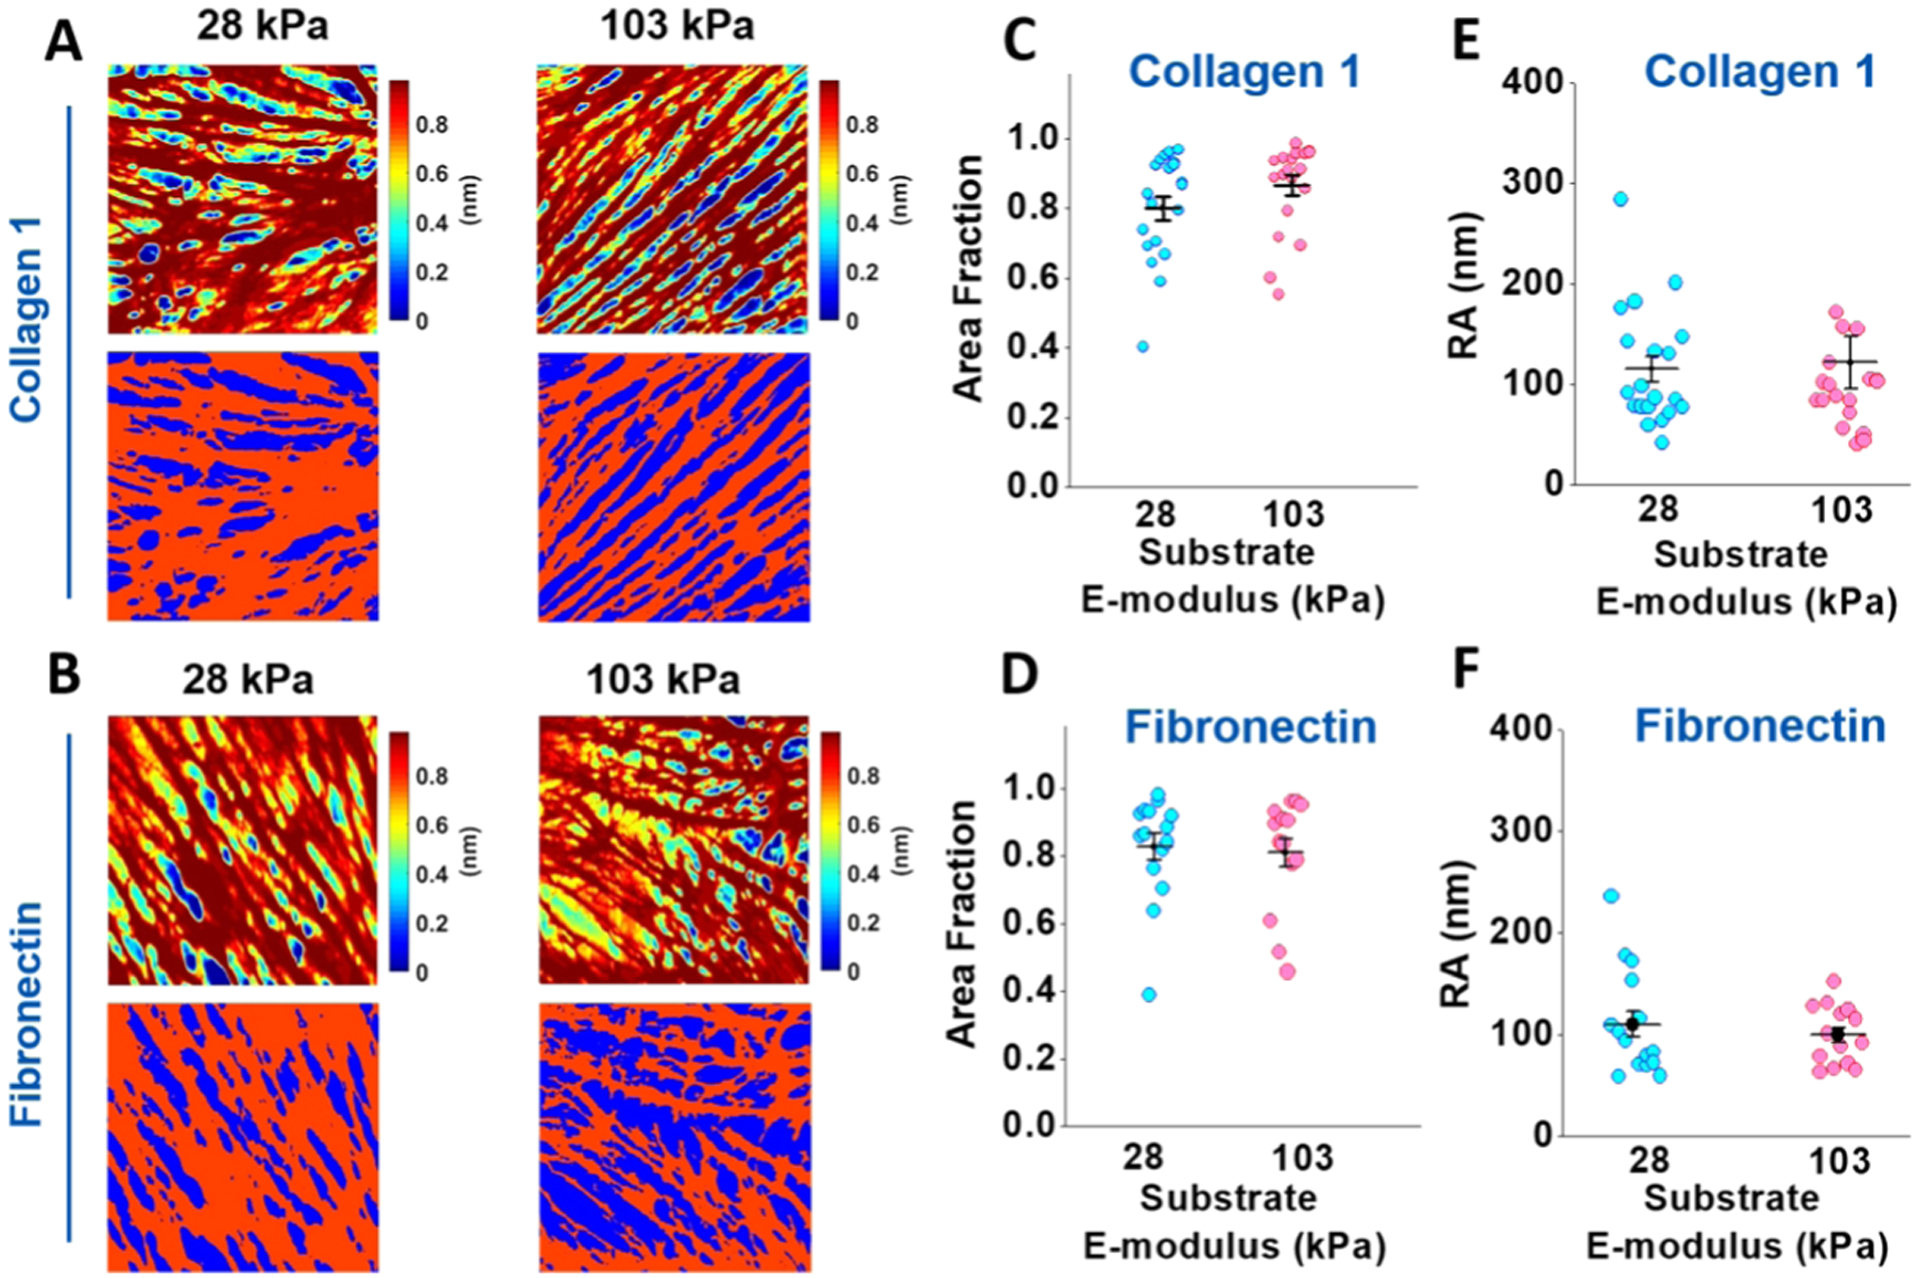
AFM height images of the cortical cytoskeleton and the area fraction of the cortical stress fiber. (A, B) Representative AFM height images for VSMCs cultured on COL1- and FN-coated 28 kPa (left) and 103 kPa (right) substrates (top row of panels (A) and (B), respectively). The color changes from blue to red indicate the increasing height of the stress fibers. The bottom row of each panel shows the threshold applied to the height image to separate the areas occupied by stress fibers (red) from the empty background (blue). (C, D) Substrate stiffness did not have a significant effect on the area occupied by stress fibers for the cells cultured on the COL1- or FN-coated substrate. (E, F) Substrate stiffness did not have a significant effect on the average roughness of the cell surface cultured on the COL1- or FN-coated substrate. For AFM imaging, 20 cells cultured on COL1 for each stiffness and 14 cells on FN for each stiffness were imaged. Data were presented as mean ± SEM.