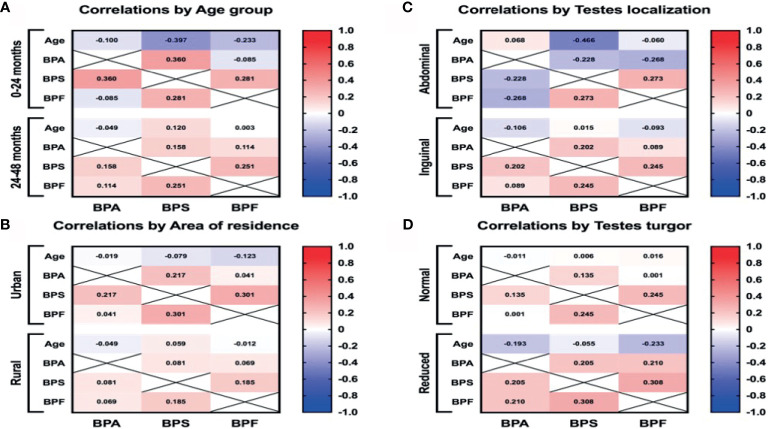
Figure 3.
The Pearson correlation between BPs plasma levels and age (A), area of residence (B), intraoperative testes localization (C), and testes turgor (D). Red and blue colors indicate positive and negative correlations, respectively. The deeper the color the more significant is the corresponding correlation.

