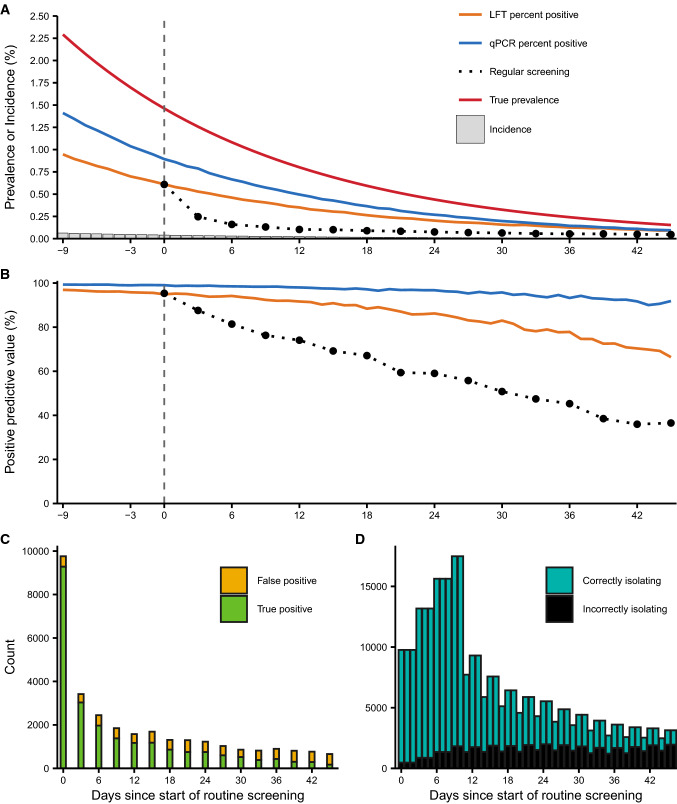
Fig. 1.
Test positivity and positive predictive value decline alongside prevalence, but the number of false positives and subsequent isolations are stable. Simulation uses a population of 1.5 million individuals to match the number of secondary school pupils tested in their first week of return to school, with prevalence, test characteristics and test frequency chosen to broadly reflect the situation in England 7. True prevalence, defined as the prevalence of all individuals within 21 days of infection, ranged from 2.29% on the first day of the strategy to 0.153% on the last day. LFT specificity is set to 99.97% and qPCR specificity to 99.99%. Full simulation assumptions and parameters are shown in the electronic supplementary material. The repeated screening strategy is initiated when true prevalence is at approximately 1.5% (vertical dashed lines). (A) Percentage of tests returning positive under random cross-sectional testing with LFT or qPCR and no isolation of positives or testing all individuals by LFT every three days with isolation of positives compared to true prevalence and incidence. Note that daily incidence ranges from 6.33 to 0.405 infections per 10,000 people (Supplementary Information Fig. S4). Black dots show the observed test positivity from the 3-day LFT screening tests performed on that day. (B) Positive predictive value (PPV) of random cross-sectional testing with LFT or qPCR, or 3-day LFT screening with removal of positives. PPV ranged from 95.3% to 36.5% for the 3-day LFT screening strategy. (C) Number of positives detected on each day of the 3-day LFT screening strategy. (D) Number of individuals in isolation over time under the 3-day LFT screening strategy, stratified by whether they were detected as a true or false positive

