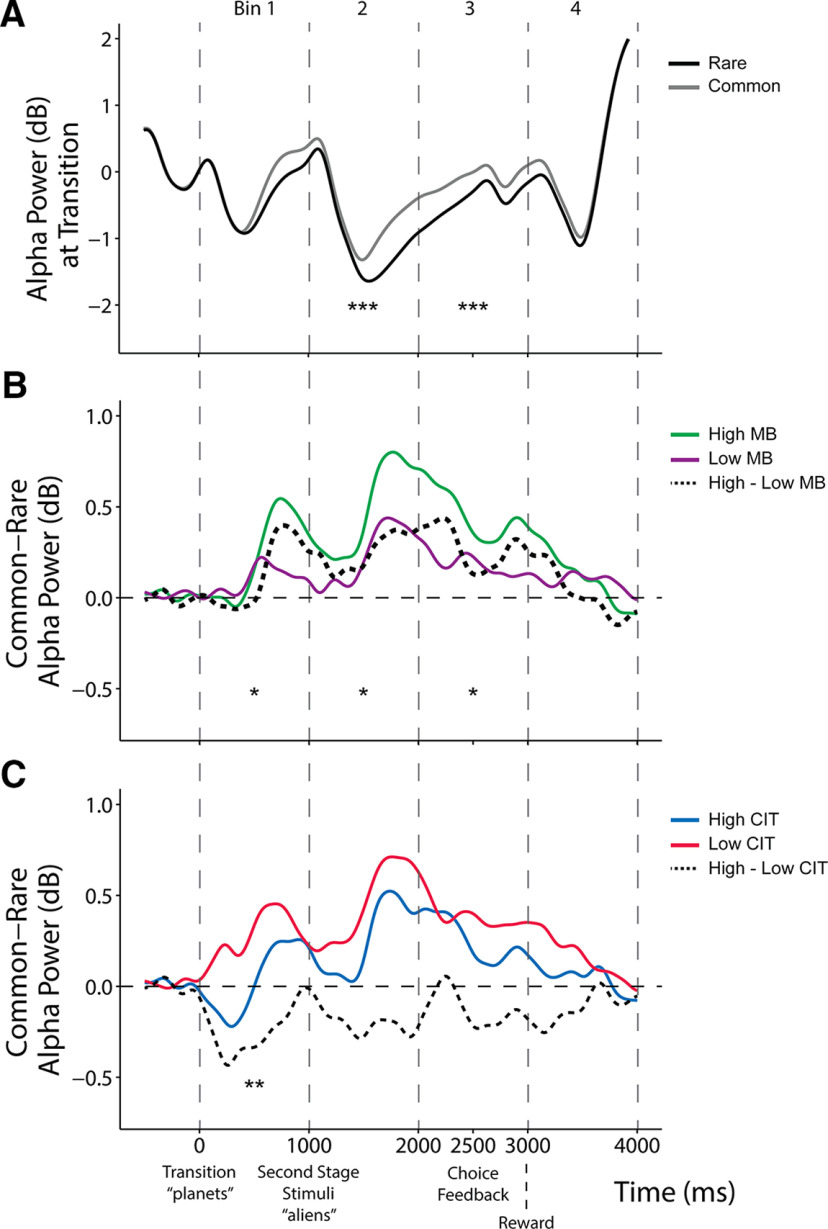
Figure 4.
Stimulus-locked alpha power at transition. Alpha power was measured across four time bins of 1000 ms each separated by vertical dashed lines, starting from the transition (0 ms) until after reward (4000 ms), at parietal-occipital electrode sites (Fig. 8A). A, Grand average second-stage alpha power waveforms between rare and common transitions. Continuous analyses revealed that the alpha difference (rare – common) is significant in time bins 2–3 (all β values > 0.03, SE < 0.01, p < 0.001). B, Alpha power difference between transitions (common – rare) is depicted above by comparing top/bottom 50th percentile (N = 96/group) of participants grouped by MB estimates. Continuous analyses revealed that α difference (rare – common) is enhanced for more model-based participants in time bins 1–3 (all β values > 0.01, SE < 0.02, p < 0.05). C, Alpha power difference between transitions (common minus rare) comparing top/bottom 50th percentile (N = 96/group) of participants grouped by or compulsivity (CIT). Continuous analyses revealed that αthe alpha difference (rare – common) is diminished for more compulsive participants in time bin 1 (β = –0.03, SE = 0.01, p = 0.007). Stars in time bins indicate significance from continuous analyses. *p < 0.05, **p < 0.01, **p < 0.001. These second-stage transition effects were specific to alpha power and were not present with theta power (Fig. 8B).

