
Figure 1.
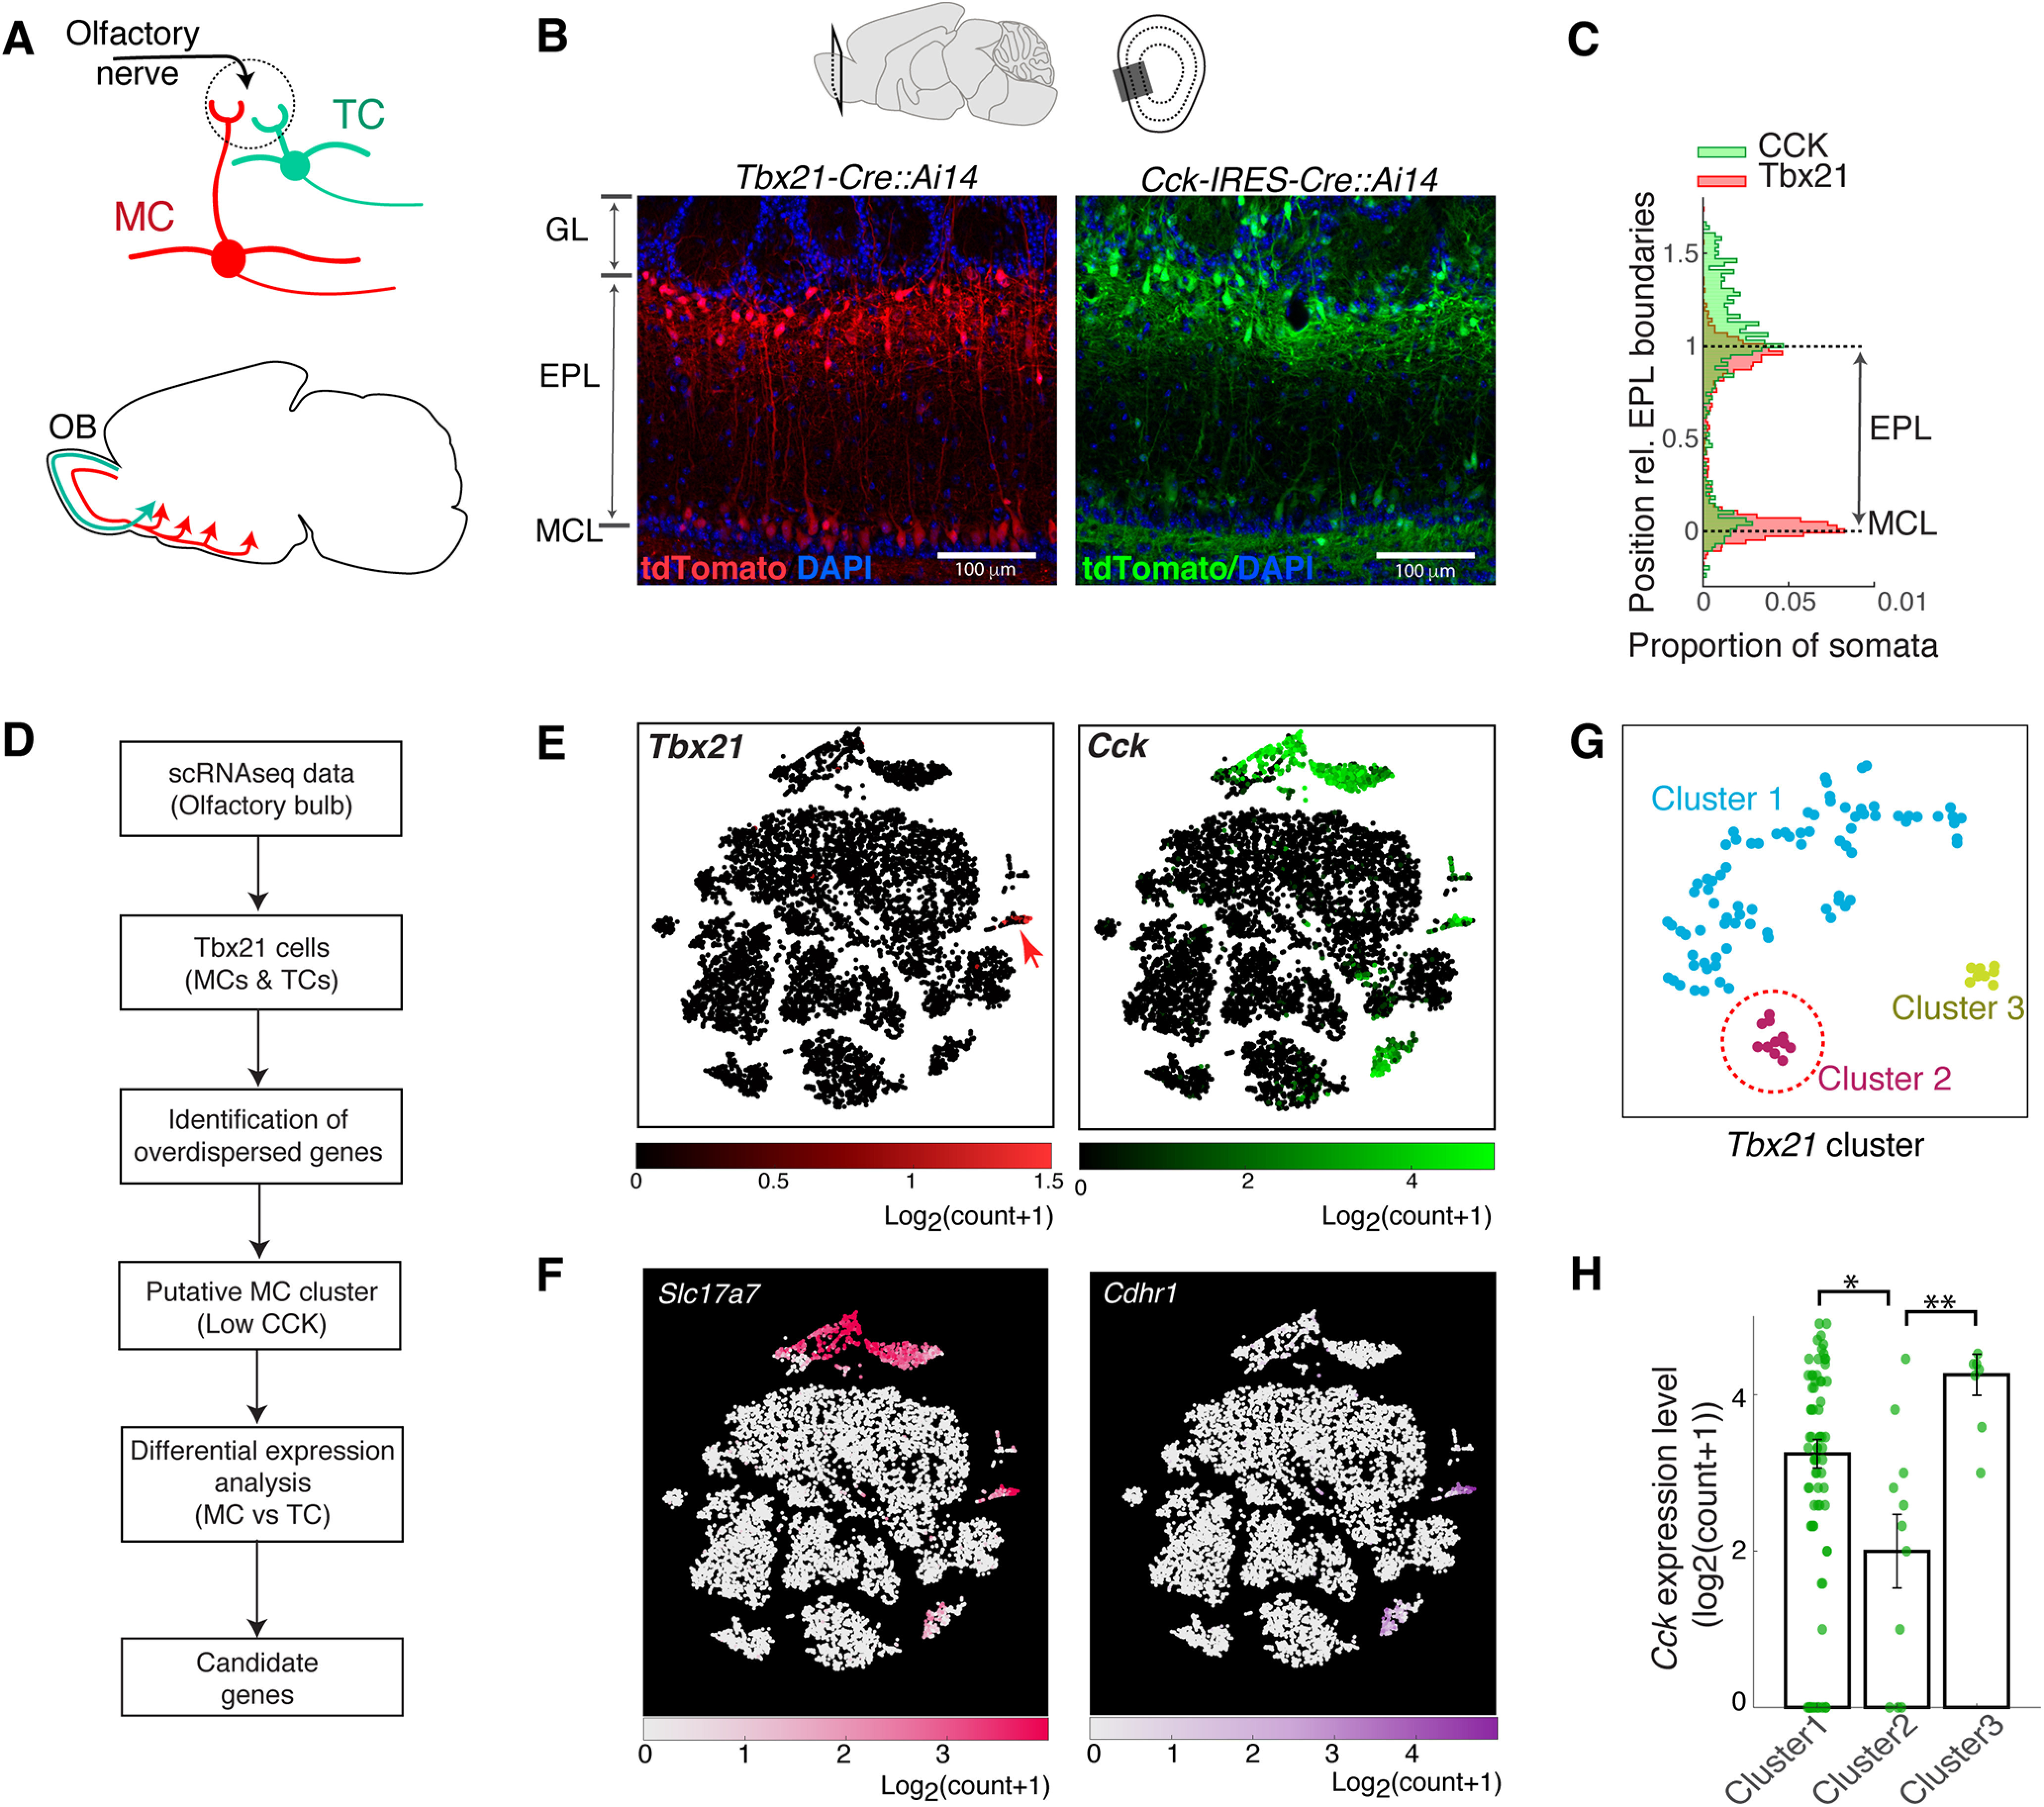
Strategy for identifying mitral-cell specific markers from scRNA-seq data. A, Schematic showing major anatomic differences between the two cell types; MCs (red) are located deeper in the OB layers and project widely in olfactory cortices. TCs (green) are smaller, superficially located principal neurons that project to anterior portions of the olfactory cortex. B, Tbx21 and Cck expression patterns in the main OB; example images showing tdTomato expression patterns in Tbx21-Cre::Ai14 mouse (red) and Cck-IRES-Cre::Ai14 mouse (green). Scale bar, 100 µm. C, Soma positions of tdTomato-expressing cells relative to the EPL boundaries, for the images shown in B. EPL depth was normalized so that it ranged from 0 to 1, with the lower boundary (MCL) corresponding to 0. D, Schematic of workflow; putative mitral cluster from scRNA-seq data is identified by the observation that MCs and TCs both express Tbx21, but Cck is more abundant among TCs. Once putative MC and TC clusters were identified, differential expression analysis was conducted to identify genes that are selectively expressed in MCs. E, OB cells plotted in tSNE coordinates, with Tbx21 and Cck expression levels (left and right, respectively) indicated with color maps shown below. F, Expression levels of common markers for projection neurons of the OB; VGlut1 (Slc17a7) and Cdhr1. G, Tbx21-positive cluster was further analyzed and the subclustered and displayed in new tSNE coordinates. H, Cck expression levels for the subclusters in E. Cluster 2 has the lowest level and is inferred to be the putative MC cluster (red dotted line in E). Statistical significance: *p = 0.05; **p = 0.01. For details, see Experimental design and statistical analysis.