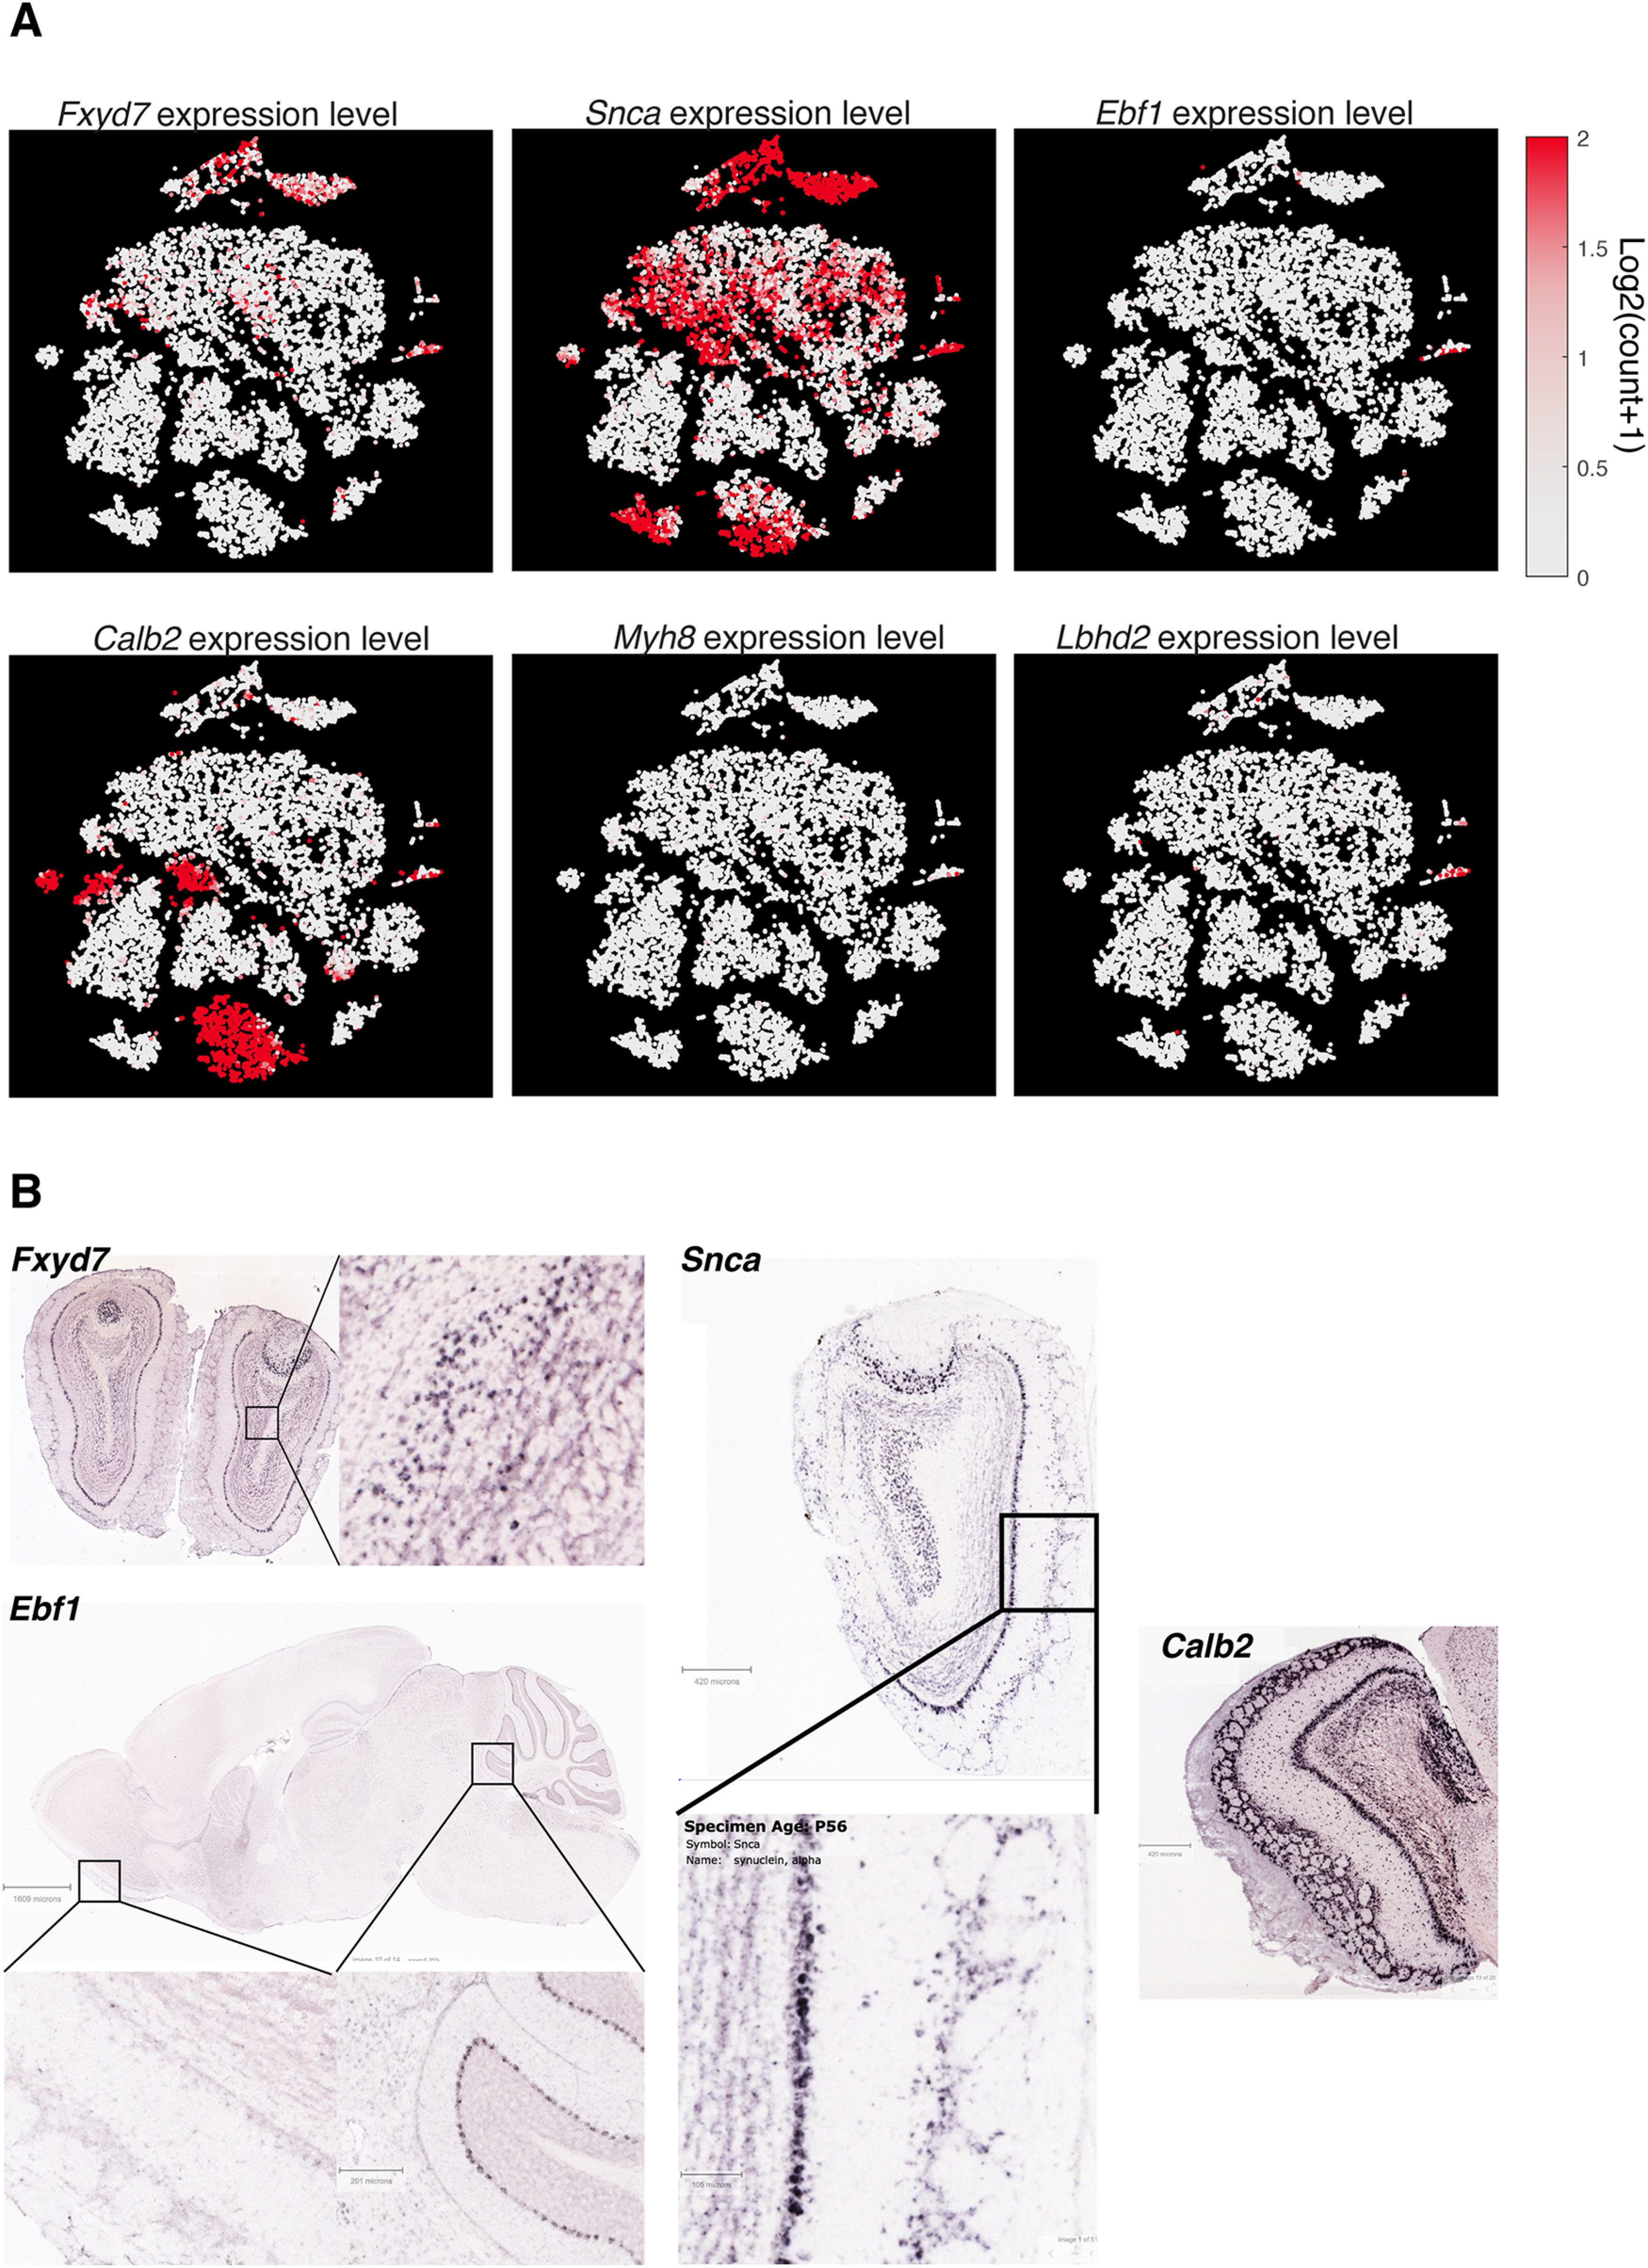
Figure 3.

OB-wide tSNE data and Allen Brain Atlas ISH data used to screen candidate MC markers that were not analyzed further. Differential expression analysis indicates that Fxyd7, Ebf1, Snca, Calb2, and Myh8 are significantly enriched in MCs relative to TCs. A, To screen candidates, the expression pattern (color map) in the whole OB data was analyzed. The same tSNE coordinates as in Figure 1E, F are used, with Lbhd2 expression pattern shown for comparison. B, Further, the ISH database of the Allen Brain Atlas was used to assess the spatial expression patterns. Fxyd7 seems to be expressed by neurons deep in the granule cell layer as well as superficial cells. Snca is expressed by some superficially located neurons as well as some neurons of the anterior olfactory nucleus. Ebf1 is hardly detectable in the OB, although it is present in the Purkinje cell layer of the cerebellum. Dense Calb2 hybridization signal is visible in the GL, EPL, MCL, as well as the granule cell layer. Myh8 signal was not described in the ISH database, but it is a marker for somatostatin-positive cells in the subventricular zone (Lim et al., 2018), which is the source of SST-positive interneurons of olfactory cortices. The expression data in A show low levels of Myh8 expression in many neurons outside of the Vglut1- and 2-positive clusters. Image credit: Allen Institute.
