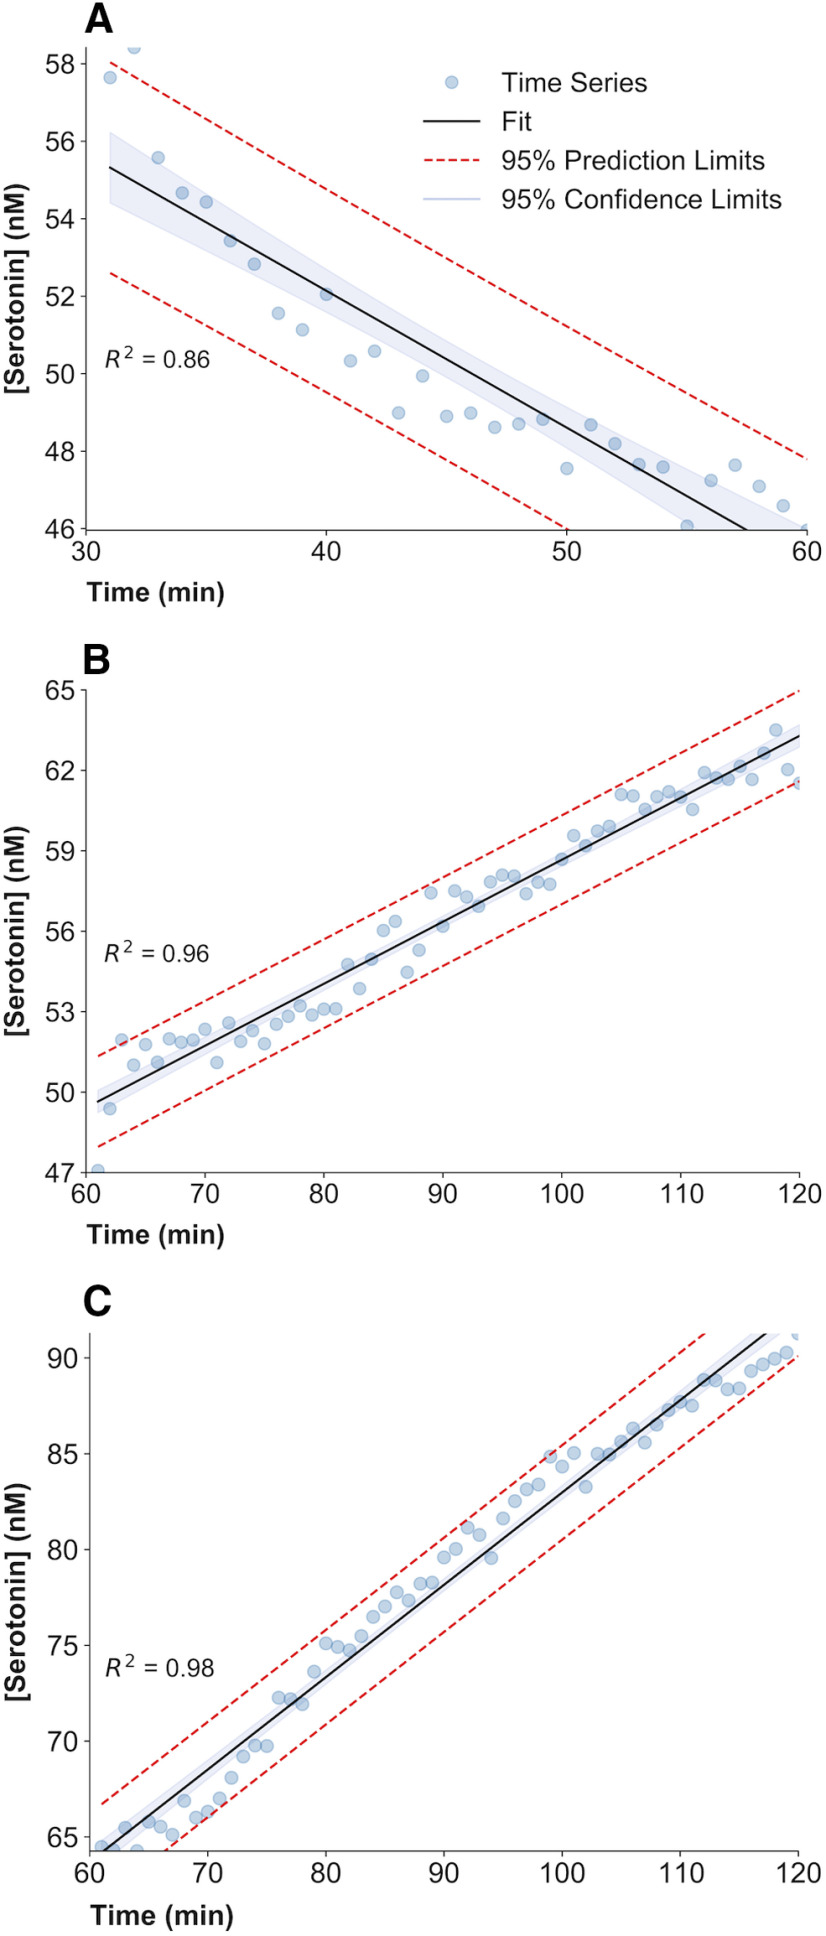
Figure 3.
Regression analysis plots. A–C, Each panel shows the experimental FSCAV time series for LPS treatment between 30 and 60 min (A), LPS + ESCIT treatment between 60 and 120 min (B), and saline plus ESCIT treatment between 60 and 120 min (C). A linear regression is fitted to each time series. The 95% prediction limits and confidence limits of the linear regression are also represented. The coefficient of determination () and the slope SEM are also calculated. The t statistic for the slope of the regression fit is calculated and proved to be significantly different from a slope of zero for all drug treatments.

