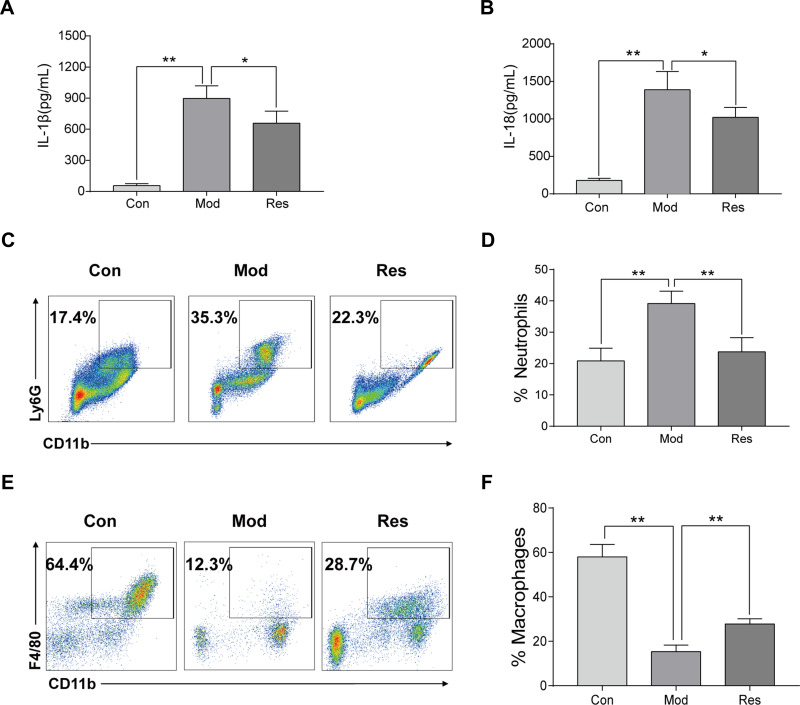
Figure 2.
Res improved MSU-induced peritonitis in mice. Intraperitoneal injection of 2 mL of 40.5 mg/mL Brewer, intraperitoneal injection of 15 mg/kg Res on day 2 for pretreatment, injected 0.5 mL of 6 mg/mL MSU on day 3 to induce peritonitis model. Lavage fluid was collected at 6 h after induction, and ELISA was used to detect the expression of IL-1β (A) and IL-18 (B), while flow cytometry was used to detect the proportion of neutrophils (C) and macrophages (E). Statistical analysis of neutrophils (D) and macrophages (F). Data are expressed as mean ± standard deviation. * indicates P < 0.05, and ** indicates P < 0.01. n = 3/group.

