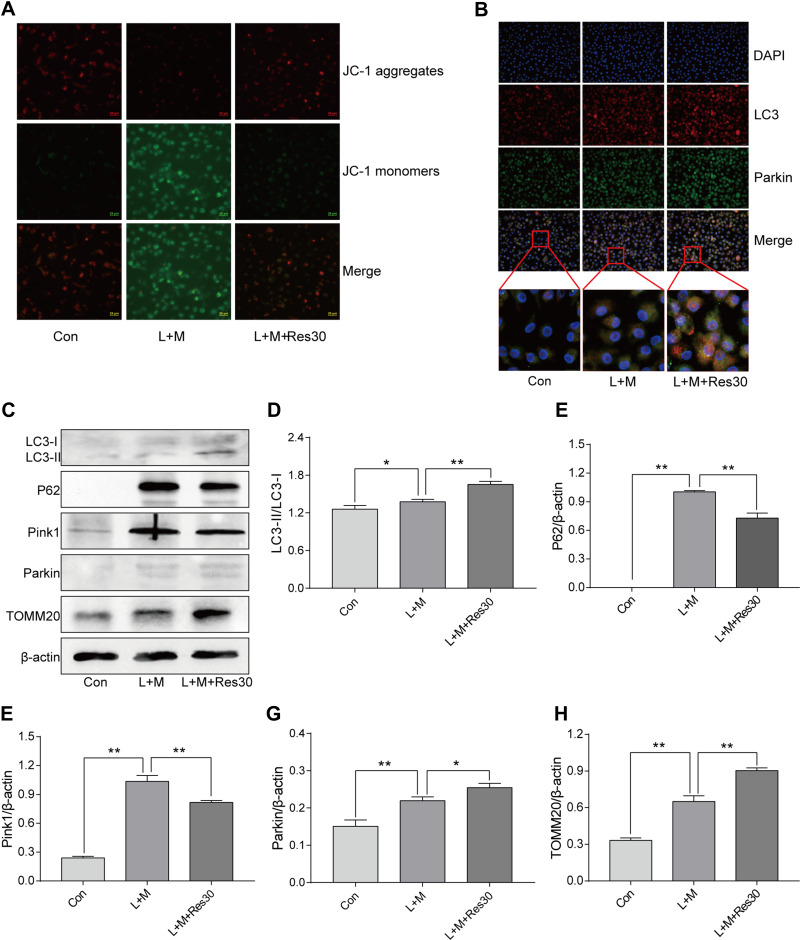
Figure 5.
Res promotes mitophagy. Detection of changes in the cell membrane potential by JC-1 (JC-1 show red fluorescence in normal cells and green fluorescence when the mitochondrial membrane potential declines (400×, 25 μM per scale)) (A); LC3 and Parkin co-localization by immunofluorescence, showing fluorescence aggregates and mitophagy after Res treatment (400×, 20 μM per scale) (B); Detection of protein expressions in cells by Western Blot (C). Statistical analysis of LC3 (D), P62 (E), Pink1 (F), Parkin (G), and TOMM20 (H). Data are expressed as mean ± standard deviation. N.S. indicates not significant, * indicates P < 0.05, and ** indicates P < 0.01.

