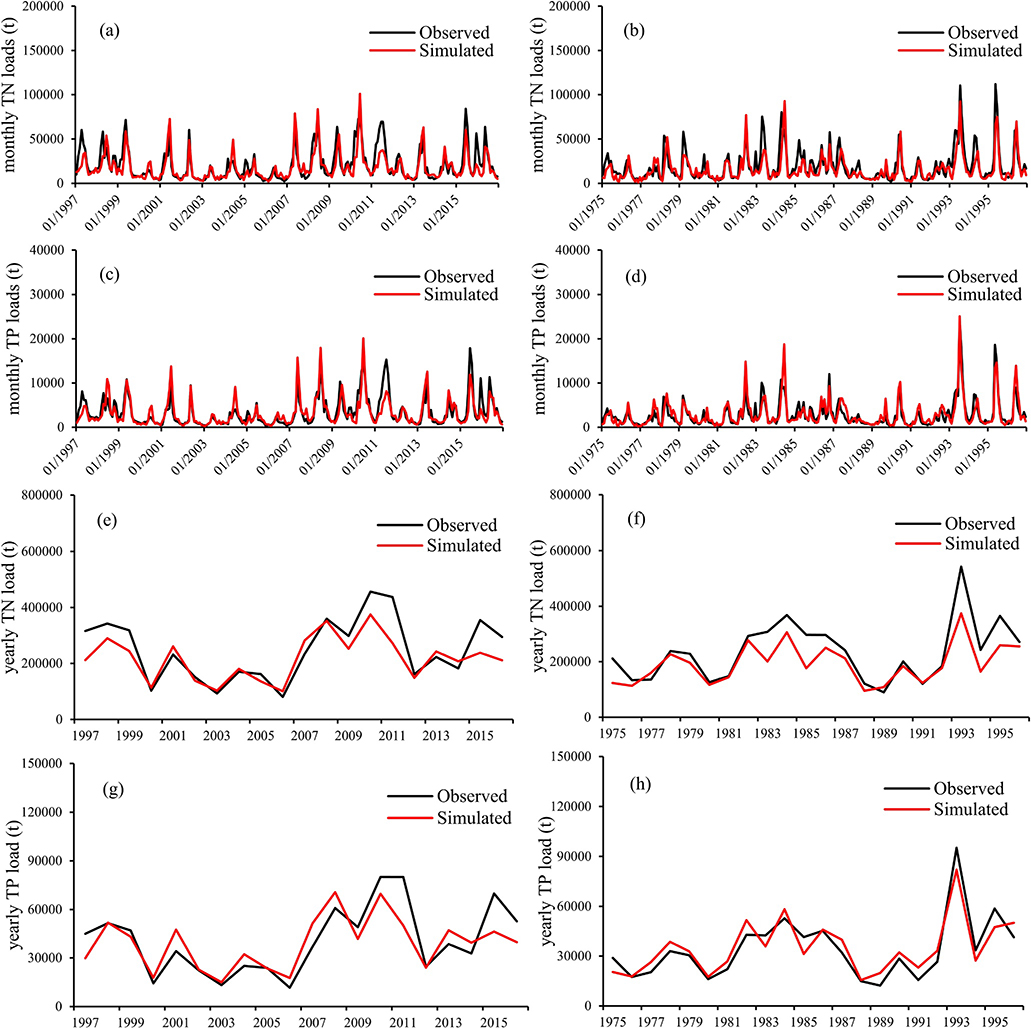
Figure 4.
Monthly and annual simulated versus observed (a and b, e and f) total nitrogen and (c and d, g and h) total phosphorus comparison between Soil and Water Assessment Tool (SWAT) simulated and monitored at Hermann station during calibration period (1997–2016) and validation period (1975–1996).

