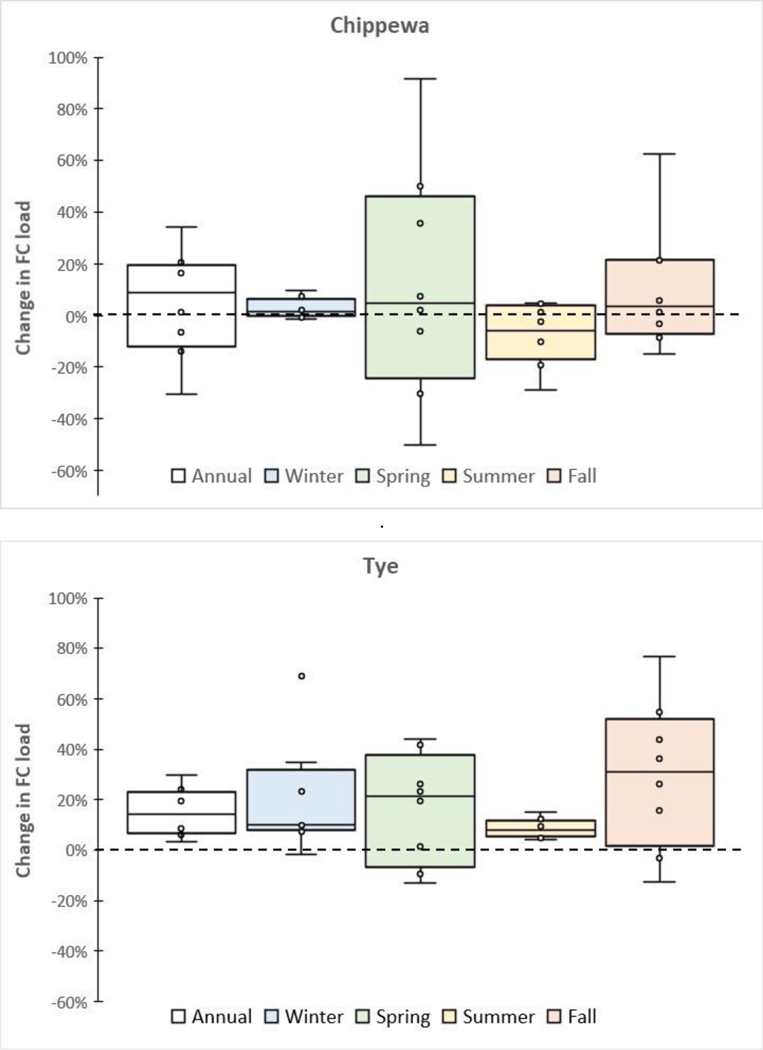
Figure 5.
Projected future changes in average FC load in the Chippewa and Tye watersheds. Percent change values are relative to the simulated 30-year baseline (1975–2005) for each model. Box and whisker plots show max and min (whiskers), 25th, 50th and 75th percentiles (box) and individual values for each GCM (circles). Details about changes associated with individual GCMs are provided in the online supporting information. Winter: Dec, Jan, Feb; Spring: Mar, Apr, May; Summer: Jun, Jul, Aug; Fall: Sep, Oct, Nov.

