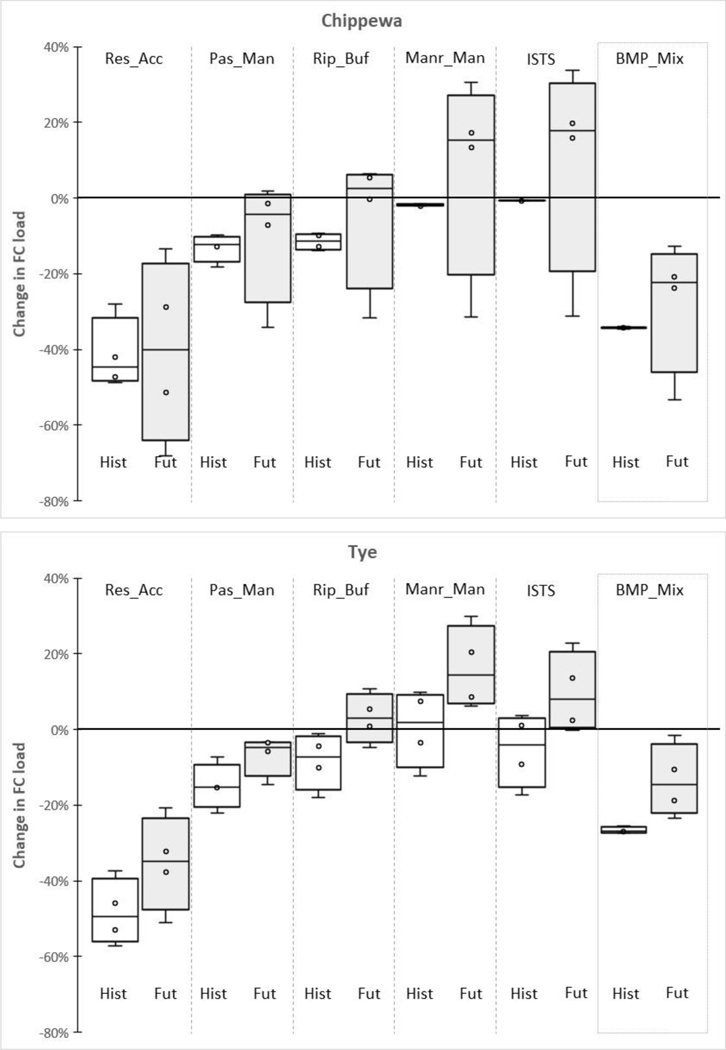
Figure 7.
Changes in annual fecal coliform load for 6 management scenarios relative to the historic baseline (1975–2005) in the Chippewa and Tye watersheds. Box and whisker plots show max and min (whiskers), 25th, 50th and 75th percentiles (box) and individual values for each GCM (circles). Details about changes associated with specific GCMs are provided in the online supporting information. Values for historical are simulated 30-year baseline (1975–2005) for each model, and not observed.

