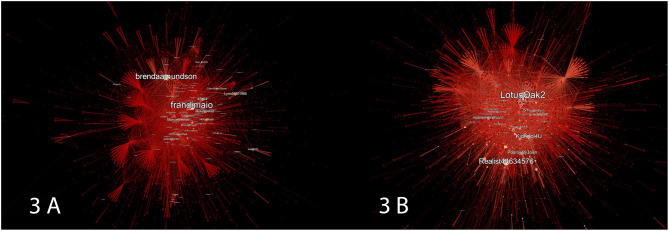
Figure 3.
In (A) we see the pre-release network and in (B) the post-release network. The nodes and edges of the pre- and post-release networks are colored according to their average out-degree measure. Likewise, the size of any given node corresponds to its average out-degree. Deeper red areas indicate lower out-degrees of nodes, and the lighter-red a node or edge is the higher its corresponding out-degree.

