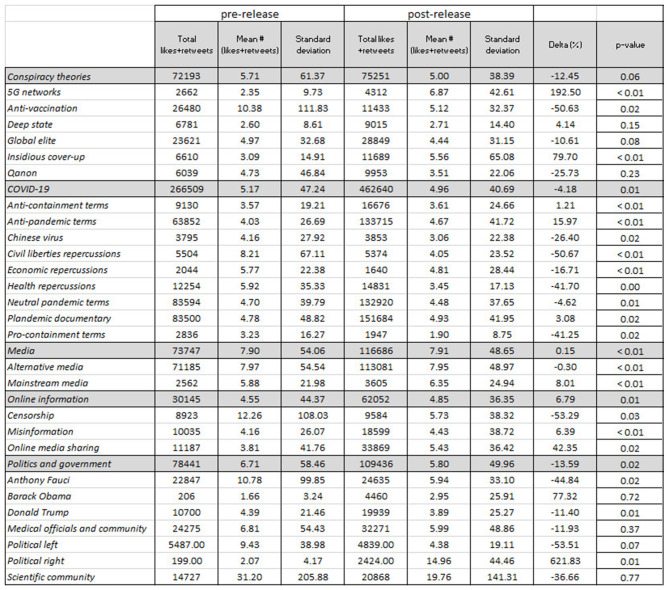
Figure 7.
Average likes + retweets for “plandemic” tweets by topic category. All tweets (n = 78,794) were collected between March 3 and June 10, 2020. Percent change is presented in the final column. Chi-squared and Welch's t-test are used to assess the difference pre- against post-release (alpha = 0.05).

