
Figure 10.
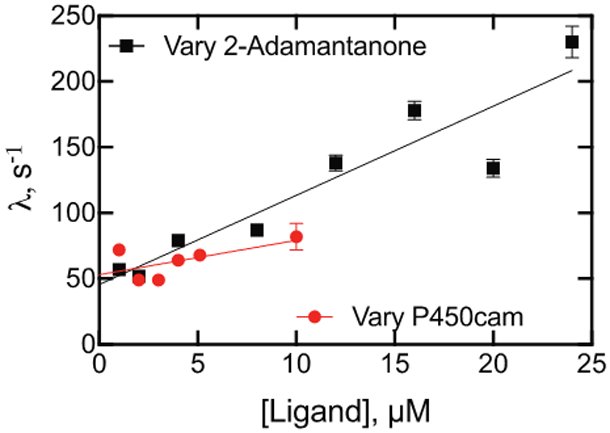
Kinetics of binding of 2-adamantanone and P450cam as a function of concentration, varying either 2-adamantanone (black, ■) or P450cam (red, ●) in the presence of a 2 μM (final) concentration of the opposite component (i.e., P450cam or 2-adamantanone). Linear regression fits are shown to denote trends, although this fit does not have a physical basis.