
Figure 4.
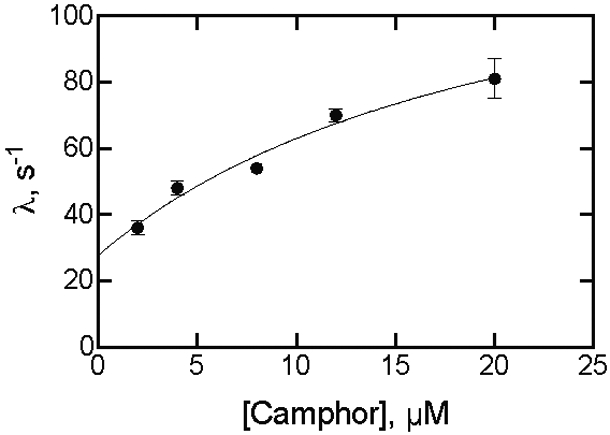
Fitting a plot of eigenvalues (kobs) for binding of camphor to P450cam as a function of camphor concentration. Points are from Figure 3A. The final P450cam concentration was 2 μM. The fit was to the equation λ = kf + kr·S/(Kd + S),20 with S being the camphor concentration, kf the forward rate constant following camphor binding, and kr the rate constant for the reverse reaction (Y= kf + kr*X/(Kd+X) in GraphPad Prism software). The fit is shown for kf = 112 ± 49 s−1 and kr = 28 ± 7 s−1. A linear regression fit yielded a slope (kon) of 2.4 (± 0.3) M−1 s−1 and y-intercept (koff) of 35 ± 4 s−1 (Kd = koff/kon = 15 μM) (not shown).