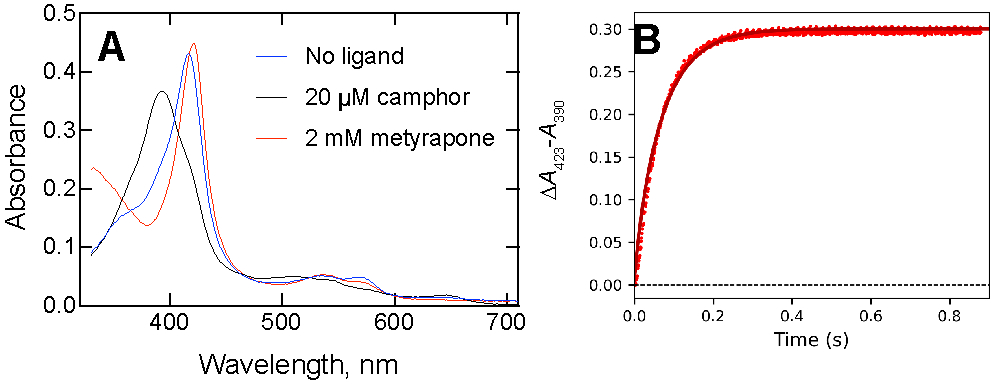
Figure 5.

Estimation of koff for the P450cam·camphor complex. (A) Spectra of P450cam (4 μM) without ligand (blue line, λmax 418 nm), with 20 μM camphor (black line, λmax 390 nm, and with 2 mM metyrapone (red line, λmax 423 nm)). (B) A mixture of 2 μM P450cam and 10 μM camphor was mixed with 2 mM metyrapone (all final concentrations). A separate assay yielded a value of 18.9 s−1 for the binding of metyrapone to ligand-free P450cam under the same conditions. The trace was fit to the model (in KinTek Explorer ® software)
