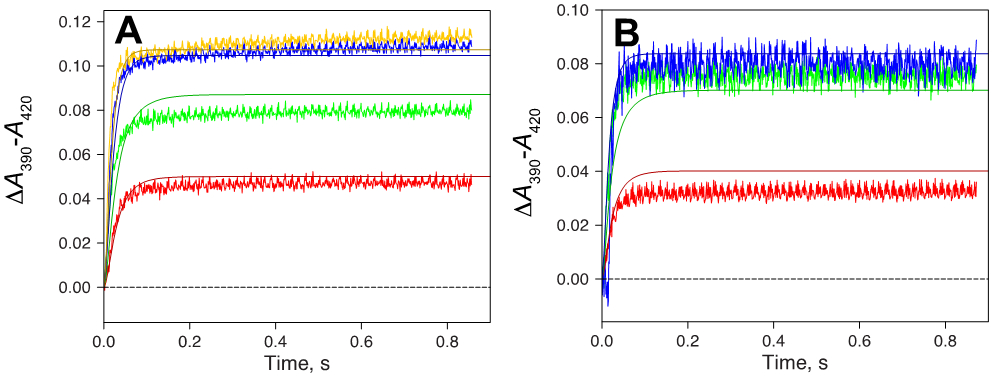
Figure 6.

Kinetic modeling of some binding data with parameters from the minimal model of Scheme 2. (A) Fixed final concentration of 1 μM P450cam. Traces are shown for 1 μM (red), 2 μM (green), 4 μM (blue), and 8 μM (yellow) camphor, plus fits (solid lines). (B) Fixed final concentration of 2 μM camphor. Traces are shown for 1 μM (red), 2 μM (green), and 4 μM (blue) P450cam, plus fits (solid lines). The rate constants are from Scheme 2.
