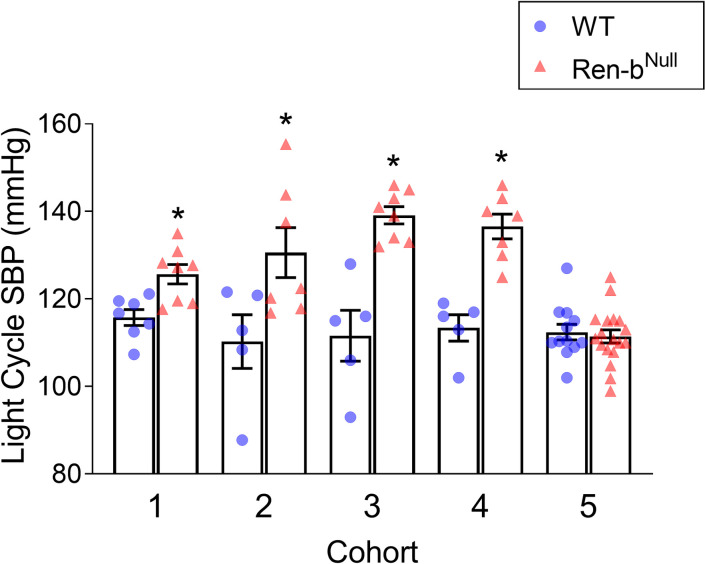
Fig 2. Cohort analysis of arterial blood pressure.
Reanalysis and comparison of the telemetric blood pressure in 5 independent cohorts of Ren-bNull and wildtype (WT) mice. Summary of the systolic blood pressure (SBP) during the light cycle is shown. This data was previously reported in references [22] and [30]. *P<0.05 vs WT by unpaired t-test.

