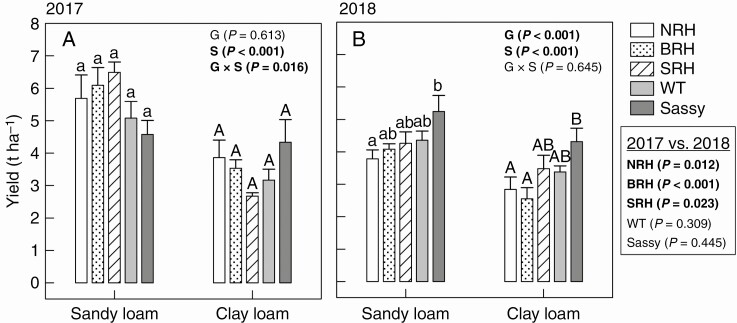
Fig. 10.
Variation in yield (t ha–1), calculated from grain weight, of contrasting root hair genotypes grown in the field in sandy loam and clay loam soils for two subsequent years: 2017 (A) and 2018 (B). Data are the mean of four replicates, with error bars representing the s.e. Differences between genotypes and soil textures were established using two-way ANOVA, P-values are reported and significant (P ≤ 0.05) parameters are in bold, with ‘G’ representing genotype, ‘S’ representing soil texture and ‘G × S’ representing the interaction of genotype and soil texture. Identical letters indicate no significant differences as tested using one-way ANOVA followed by a post-hoc Tukey’s test. Cross comparisons between experimental years were established using two-way ANOVA, P-values are reported in the box, with significant (P ≤ 0.05) parameters in bold. NRH represents the no root hair genotype; BRH, the bud root hair genotype; SRH, the short root hair genotype; and WT, the wild type all in the ‘Optic’ background, together with ‘Sassy’.

