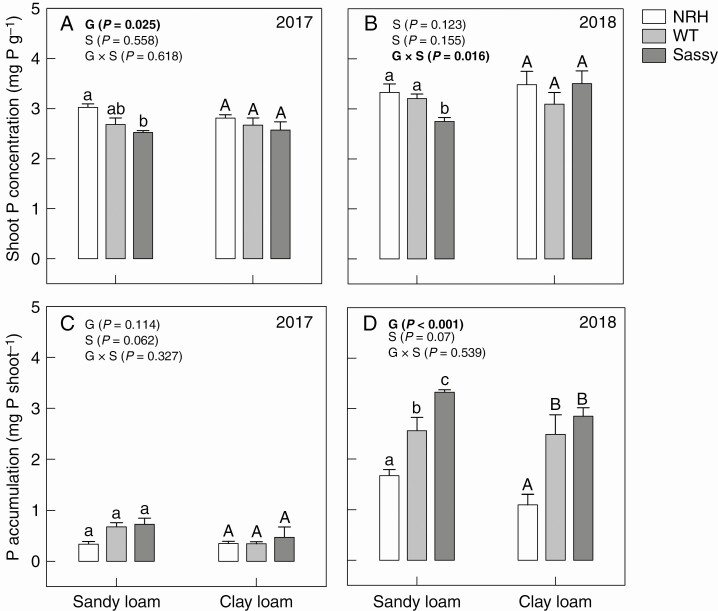
Fig. 9.
Variation in shoot P concentration (mg P g–1; A, B) and shoot P accumulation (mg P per shoot; C, D) of contrasting root hair genotypes grown in the field in sandy loam and clay loam soils for two subsequent years: 2017 and 2018. Data are the mean of four (2017) and eight replicates (2018), with error bars representing the s.e. Differences between genotypes and soil textures were established using two-way ANOVA, P-values are reported and significant (P ≤ 0.05) parameters are in bold, with ‘G’ representing genotype, ‘S’ representing soil texture and ‘G × S’ representing the interaction of genotype and soil texture. Identical letters indicate no significant differences as tested using one-way ANOVA followed by a post-hoc Tukey’s test. NRH represents the no root hair genotype and WT the wild type (‘Optic’), together with ‘Sassy’.

