
Fig 4. M protein-specific cTfh responses increase from the first to the second convalescent visit (N = 26).
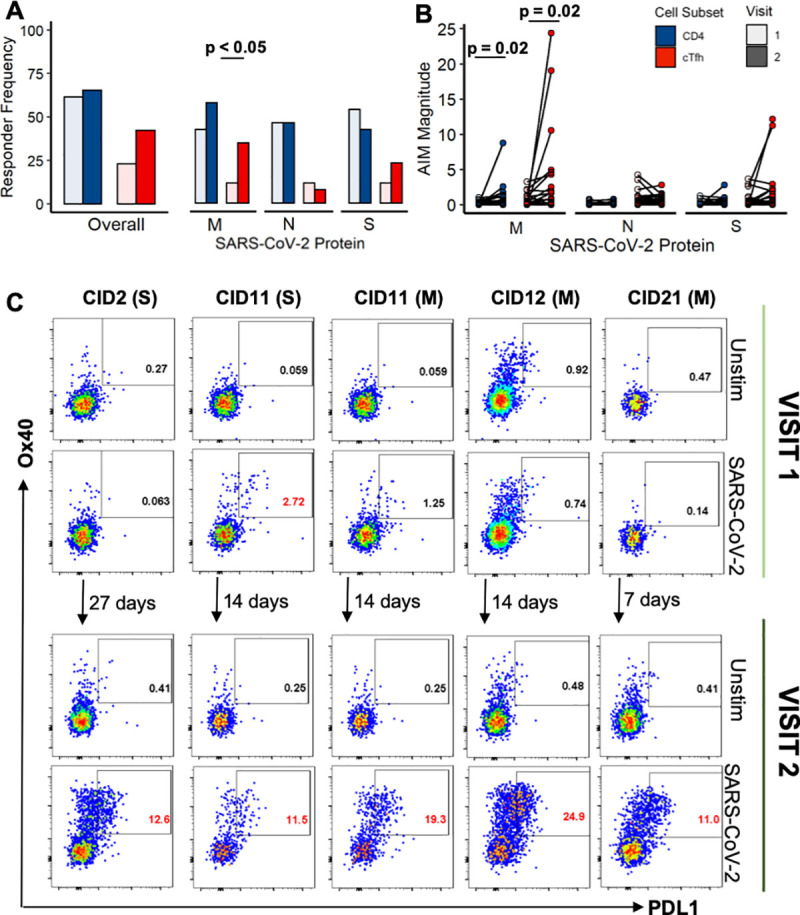
(A) Paired convalescence Visit 1 and Visit 2 CD4 T-cell and cTfh response magnitudes by AIM (p values determined by Fisher’s Exact Test). (B) Paired CD4 T-cell and cTfh response magnitudes for AIM (p values determined by a paired Wilcoxon Signed-Rank Test). (C) Flow plots for both the first (top) and second (bottom) convalescent visit of individuals where robust cTfh responses (>5%) developed. Unstimulated negative control shown for each. SARS-CoV-2 protein to which response is directed is listed next to the PTID in parentheses. Positive SARS-CoV-2-specific responses are indicated by gate frequencies in red.