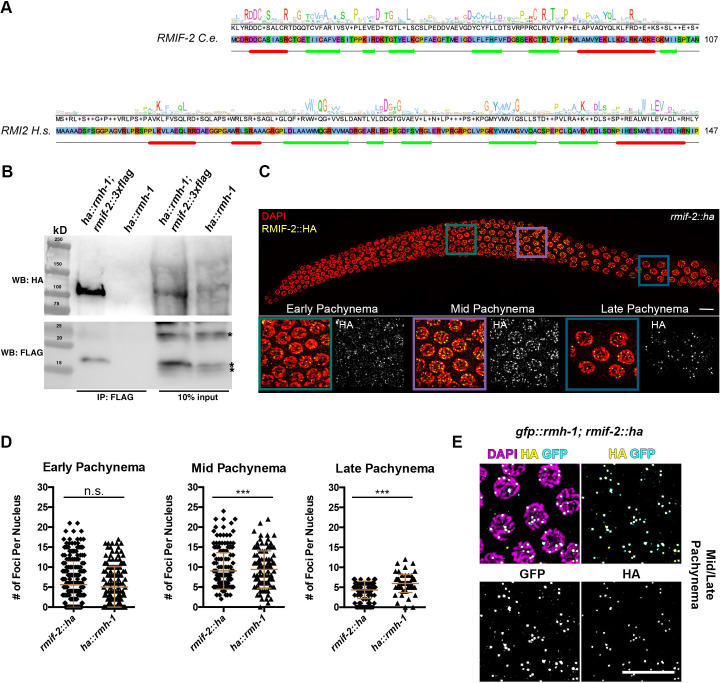
Fig 1. RMIF-2 as a functional homolog of RMI2.
(A) A conservation histogram and consensus sequence (top lines), primary sequence (middle) and a secondary structure prediction (bottom line) of Caenorhabditis elegans RMIF-2 (UniProt accession Q8MXU4) and Homo sapiens RMI2 (Q96E14). In the case of RMIF-2, the conservation histogram and the consensus sequence are based on an alignment of nematode orthologs, and for RMI2 a wide selection of eukaryotic orthologs was used, including animal and plant sequences. Sequence letters were highlighted in the ClustalX color scheme to indicate amino acids with similar physicochemical properties. Secondary structure elements were predicted (Jpred), where the helices are marked as red tubes, and sheets as green arrows (JNETPSSM), [59]. Both families share the sequential arrangement of a five-stranded beta sheet and a c-terminal alpha helix. (B) Western blot analysis of FLAG pull downs revealed robust co-immunoprecipitation of HA::RMH-1 and RMIF-2::3×FLAG. ha::rmh-1 worms were used as the negative control. The predicted size of RMIF-2::3×FLAG is 16 kD and HA::RMH-1 109 kD. IP, immunoprecipitation; WB, western blot. Asterisks indicate unspecific bands. (C) A Representative image of RMIF-2 foci localization throughout the C. elegans gonad (stained with DAPI in red and HA in yellow). Foci start to appear in early pachynema and increase in number throughout mid pachynema; in the late stages of pachynema, foci numbers are reduced. Scale bar: 10μm. (D) Mean numbers of RMIF-2::HA and HA::RMH-1 foci throughout pachynema: early pachynema, 5.6 (±5.8 SD) RMIF-2 foci (n = 221) and 5 (±5.1 SD) RMH-1 foci (n = 156 nuclei); mid pachynema, 9.0 (±4.6 SD) RMIF-2 foci (n = 184) and 9.4 (±4.7 SD) RMH-1 foci (n = 106); and late pachynema, 4.3 (±2.2 SD) RMIF-2 foci (n = 118) and 5.9 (±2.3 SD) RMH-1 foci (n = 63); three gonads per genotype. Significant differences were determined using a Student T-test: ns = not significant (p > 0.05); *** p < 0.005. Data are the mean and standard deviation (error bars). (E) Representative images of C. elegans mid/late pachynema nuclei stained with DAPI (magenta), HA (yellow) and GFP (cyan). RMH-1 and RMIF-2 foci co-localize in mid–late pachynema nuclei. Scale bar: 10μm.

