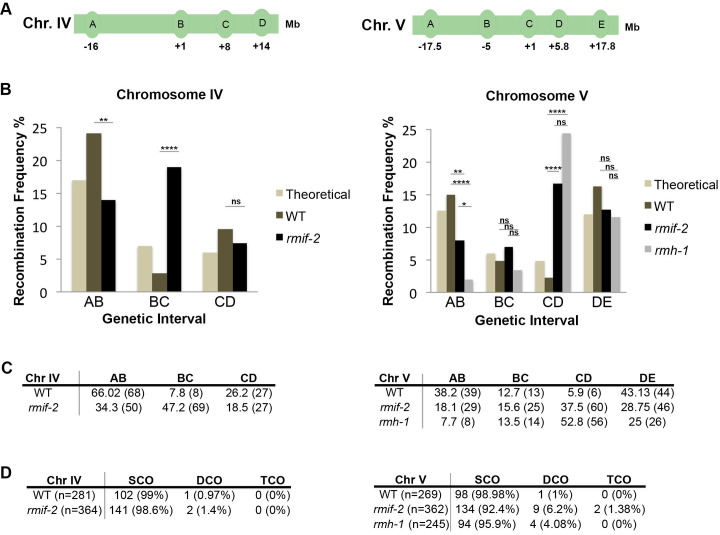
Fig 7. RMIF-2 controls the CO position and suppresses the formation of additional COs.
(A) Schematic diagrams of chromosome (Chr.) IV (left) and V (right), showing the locations of the SNPs used in the PCR-based recombination assay. (B) Recombination frequencies on chromosomes IV (left) and V (right) assessed for different genetic intervals in WT, rmif-2 and rmh-1. The ‘theoretical’ column is the expected recombination frequency based on the published genetic distance (http://www.wormbase.org). Statistical significance for recombination frequency over the total amount of worms was calculated using the Fisher’s exact test: Chr. IV WT vs rmif-2 ns (p = 0.568); Chr. V WT vs rmif-2 ns (p = 0.4579); wt vs rmh-1 ns (p = 0.6507); rmif-2 vs rmh-1 ns (p = 0.8662). Statistical significance of recombination frequencies between specific SNPs was calculated via a χ2 test: Chr IV Interval AB: WT vs Theoretical ns (p>0.05); WT vs rmif-2 ** (p = 0.0048); Interval BC: WT vs Theoretical ns (p>0.05); WT vs rmif-2 **** (p<0.0001); Interval CD: WT vs Theoretical ns (p>0.05); WT vs rmif-2 ns (p = 0.2749). Chr V Interval AB: WT vs Theoretical ns (p>0.05); WT vs rmif-2 ** (p = 0.0062); WT vs rmh-1 **** (p<0.0001); rmif-2 vs rmh-1 * (p = 0.0362). Interval BC: WT vs Theoretical ns (p>0.05); WT vs rmif-2 ns (p = 0.5759); WT vs rmh-1 ns (p = 0.8938); rmif-2 vs mrh-1 ns (p = 0.6760). Interval CD WT vs Theoretical ns (p>0.05); WT vs rmif-2 **** (p<0.0001); WT vs rmh-1 **** (p<0.0001); rmif-2 vs rmh-1 ns (p = 0.1063). Interval DE: WT vs Theoretical ns (p>0.05); WT vs rmif-2 ns (p = 0.0981); WT vs rmh-1 ns (p = 0.0533); rmif-2 vs rmh-1 ns (p = 0.6122). Number of animals analyzed Chr IV: WT 281 worms, rmif-2 364 worms; Chr V: WT 269 worms, rmif-2 362 worms; rmh-1 245 worms. COs were shifted toward the chromosome center in the mutants compared with the WT. (C) The table contains the percentage of SNPs in each genetic interval on Chr IV (left) and Chr V (right). The number of COs per interval is shown in brackets. (D) Table displaying the number and percentage (in brackets) of single (SCO), double (DCO) and triple (TCO) crossovers in the genotypes analysed. n indicates the number of worms analyzed. χ2 test analysis showed that the change in crossover distribution between WT and rmif-2 is significantly different on both chromosome IV (*** p = 0.0006) and chromosome V (** p = 0.0027). The change in crossover distribution between WT and rmh-1 on chromosome V was statistically significant (**** p<0.0001). The change in crossover distribution between rmif-2 and rmh-1 on chromosome V was not statistically significant (p = 0.0995).

