
Figure 2: A machine learning model predicts the gut microbiota of the post-FMT patient.
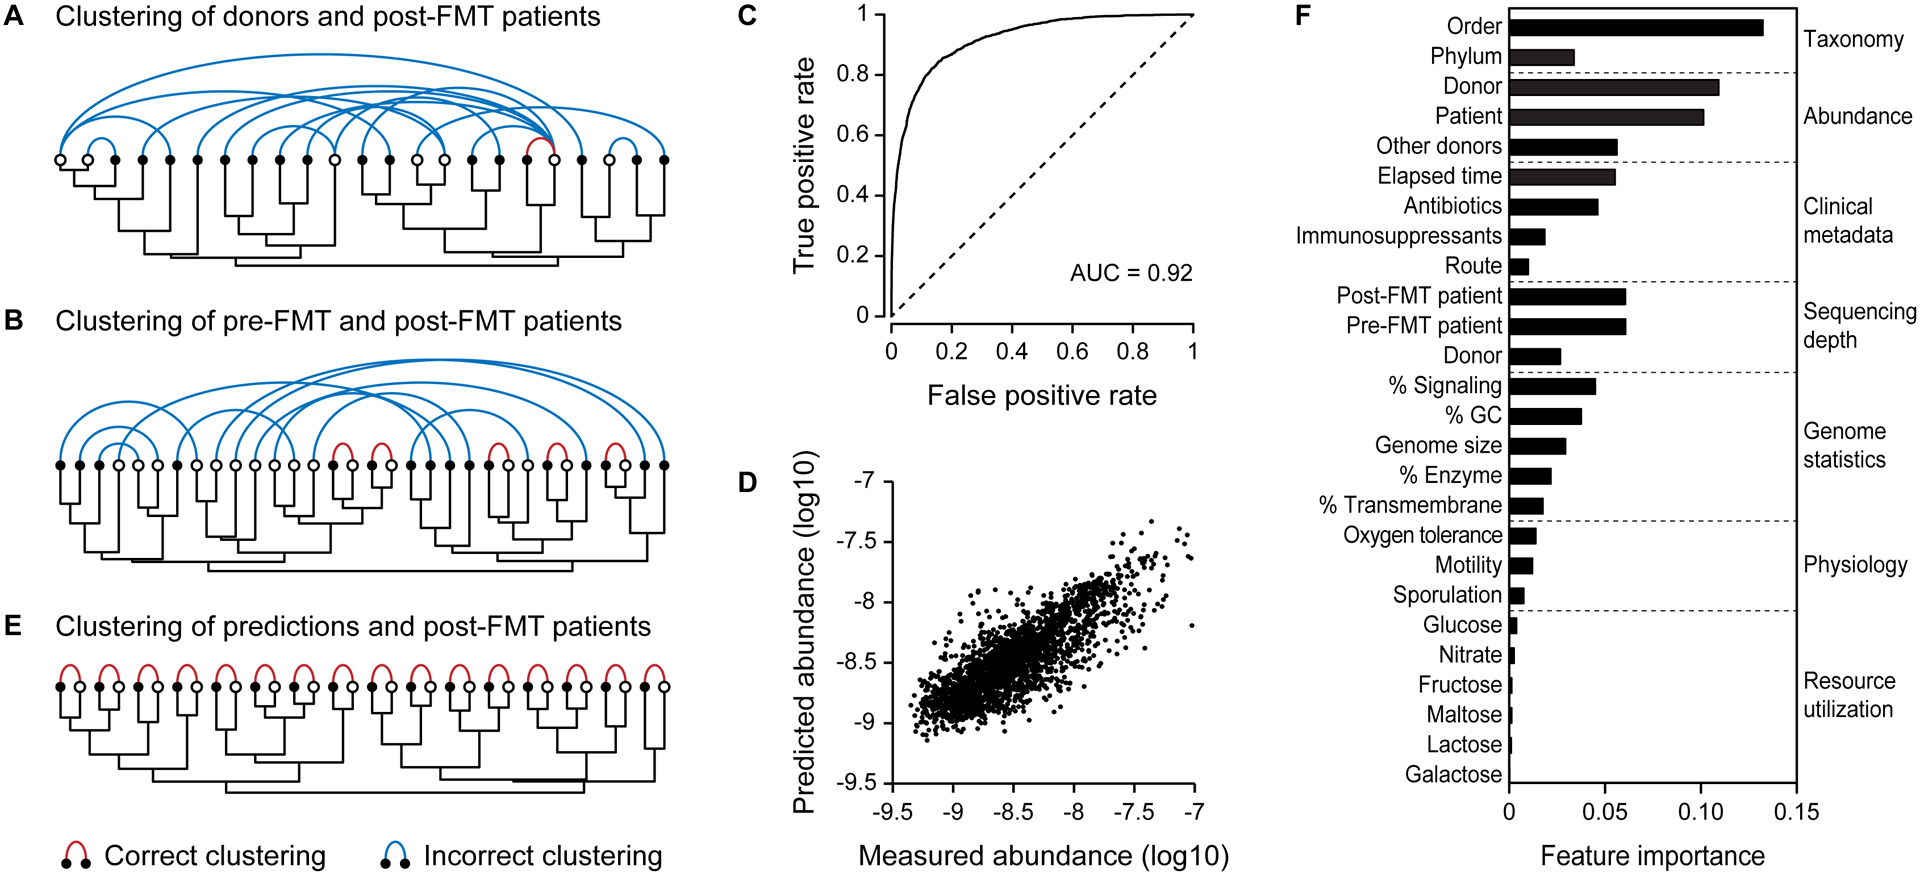
Samples were clustered according to their species compositions (dendrograms). Samples from the same patient are connected with colored arcs. (A) Donor samples (white dots) do not cluster with the corresponding post-FMT patient samples (black dots). (B) Pre-FMT patient samples (white dots) do not cluster with the corresponding post-FMT samples (black dots). (C) The receiver operating characteristic (ROC) curve for the model of mg-OTU presence. (D) Predicted abundances were correlated to the measured abundances in the post-FMT samples. (E) Samples from post-FMT patients (black dots) cluster perfectly with their predicted values (white dots). (F) The mean relative importance of each feature across both models. Because sequencing depth was only used in the model of OTU presence, only this feature importance is reported.