
Figure 4: Strain Finder outperforms ConStrains on simulated metagenomic alignments generated from a set of Escherichia coli genomes.
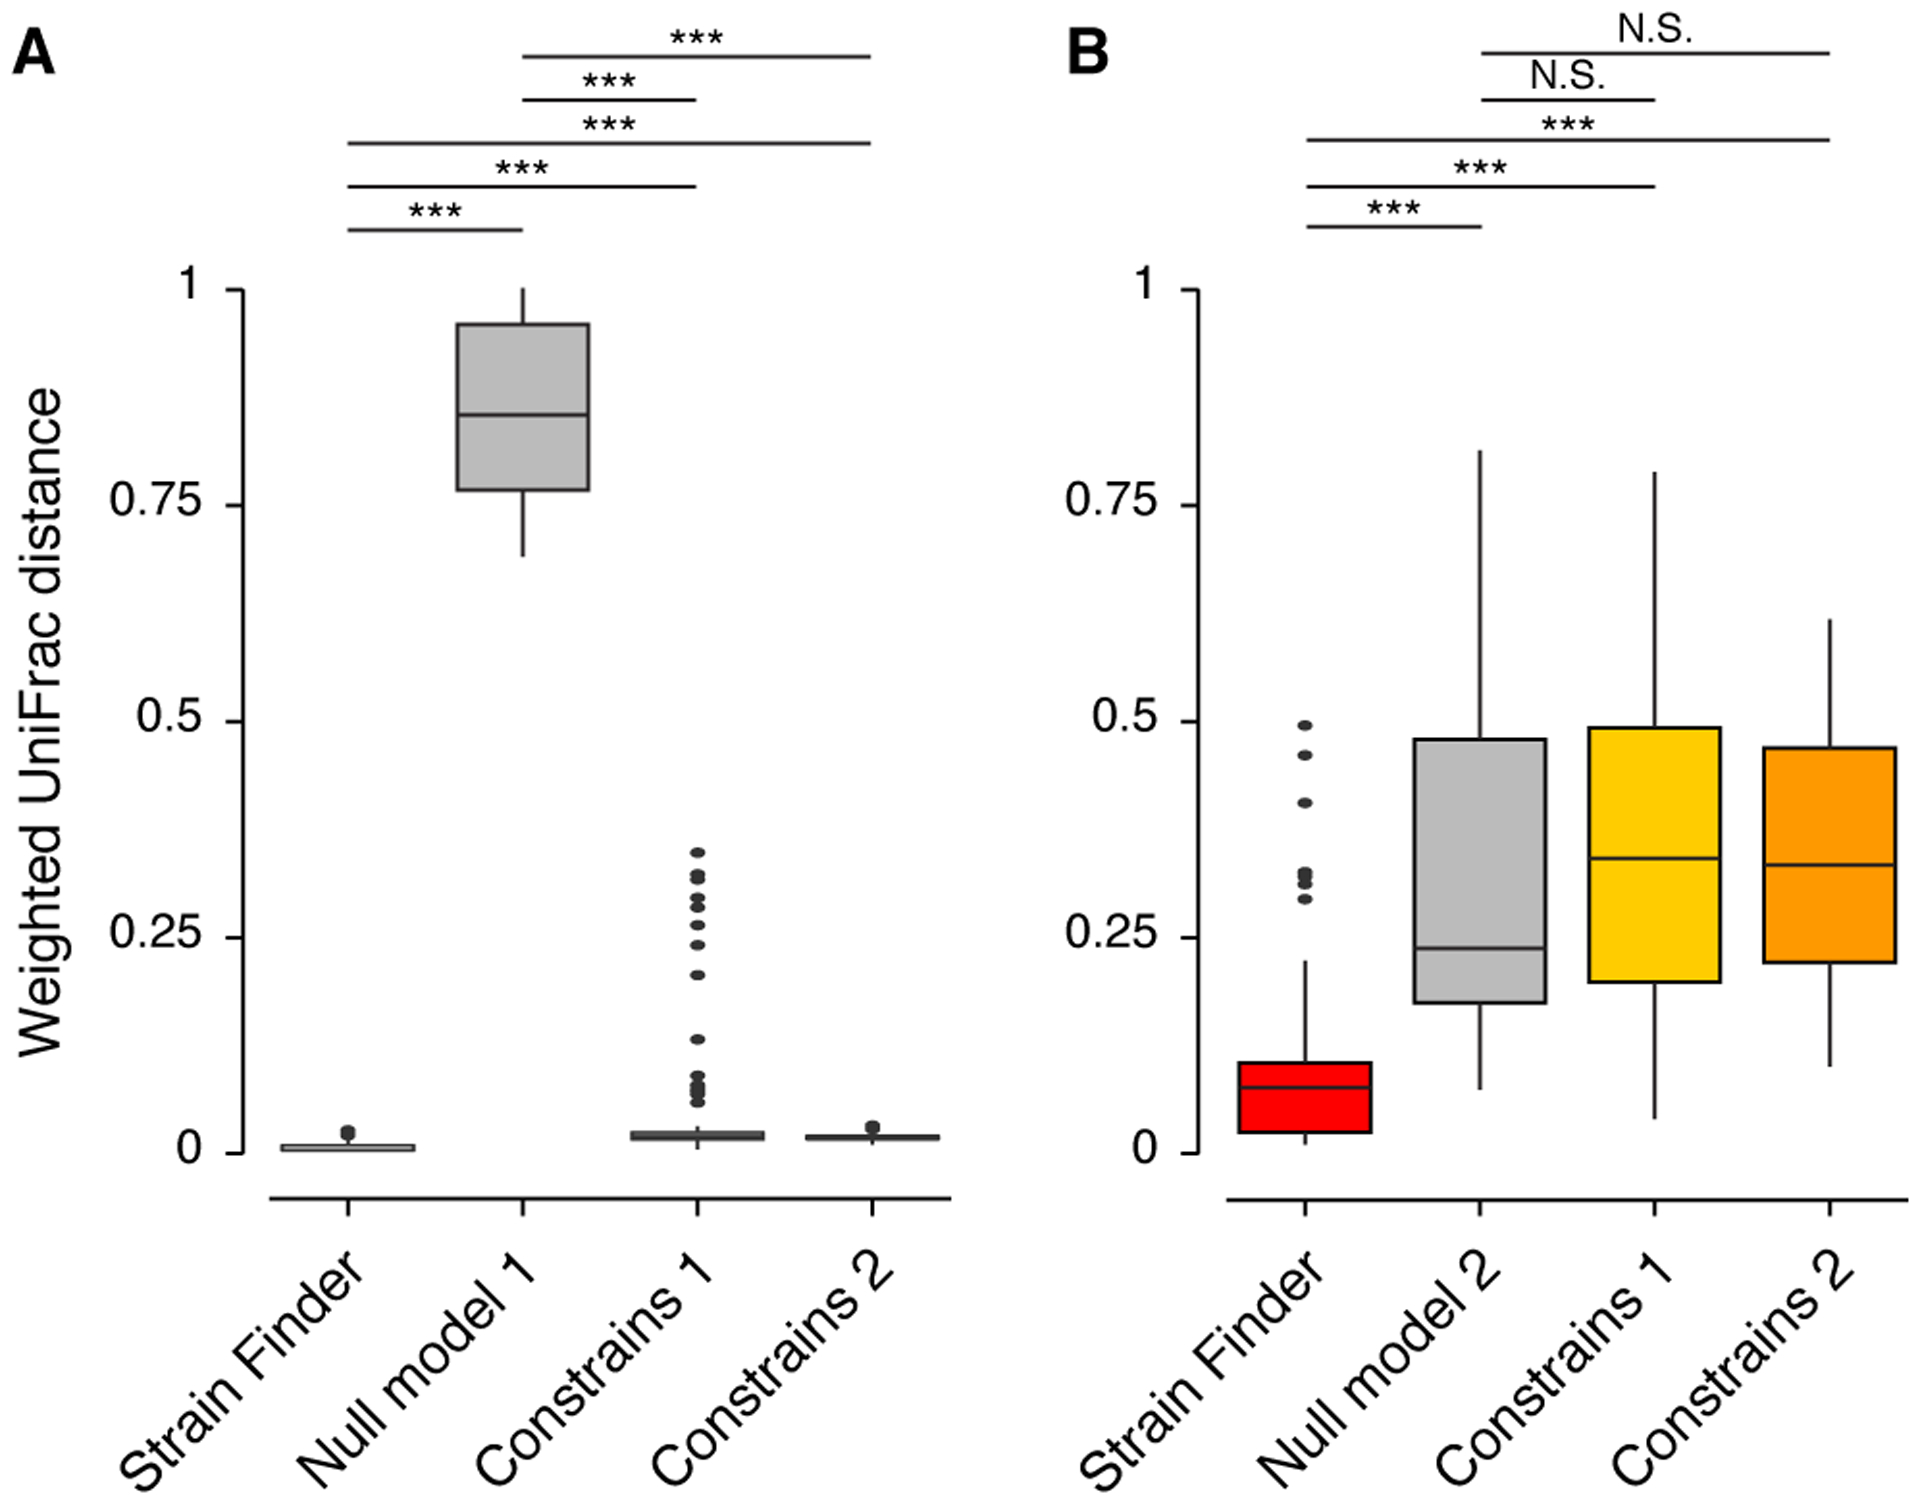
We simulated 16 metagenomic alignments of 8 samples each, with varying numbers of strains (N = 4, 8, 12, and 16) and depths of coverage (N = 25, 100, 500, and 1,000X). ConStrains was run on each sample separately (CS Model 1) and on all samples combined (CS Model 2). (A) The weighted UniFrac distances from the true strain profiles to the predictions of Strain Finder, ConStrains, and Null Model 1. (B) The weighted UniFrac distances from the true strain profiles to the predictions of Strain Finder, both ConStrains models, and Null Model 2. Asterisks denote significant comparisons (*** = p-value < 1e-10) as determined by a Wilcox test. N.S. denotes non-significant comparisons.