
Fig. 1. Annotating 51 cell types from 13 tissues using single-cell transcriptomics data.
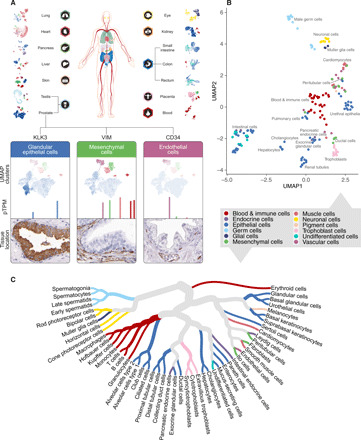
(A) scRNA-seq data from 13 tissues and blood [peripheral blood mononuclear cells (PBMCs)] were processed through a clustering algorithm, and each cluster was annotated using known markers. All cells from a cluster were pooled, and the average transcript per million was calculated for all protein-coding genes. (B) UMAP plot showing the relationship of all cell types from all analyzed tissues. The color-coding corresponds to 12 main cell type groups. (C) Cell type dendrogram showing the relationship between all 51 identified main single cell types based on genome-wide expression.