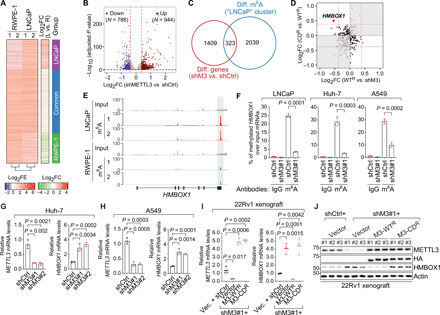
Fig. 2. HMBOX1 mRNA is modified with m6A mark and down-regulated by catalytically active METTL3 in multiple types of cancer cells.

(A) Heatmaps for differential m6A patterns between RWPE-1 and LNCaP. FE, fold enrichment of m6A signals over input; FC, fold change of m6A signals in LNCaP versus in RWPE-1 (L vs. R). (B) Volcano plot of differentially expressed genes upon knockdown of METTL3 in LNCaP cells. N, numbers of significantly changed genes [log2 fold change (FC) = ±log2(1.3) indicated by the red dashed lines and P = 0.05 by the black dashed line]. (C) Venn diagram showing the overlap between differentially expressed genes upon METTL3 knockdown (shM3 versus shCtrl) and mRNAs with stronger m6A intensity in LNCaP cells (LNCaP cluster). (D) Scatterplot showing the expression changes of the overlapped genes in (C) in the METTL3 rescue system. (E) IGV browser tracks of MeRIP/m6A-seq data at the genomic location of HMBOX1. (F) MeRIP-qPCR analysis of m6A signals on HMBOX1 mRNAs in the specified cells, which were infected with control shRNA (shCtrl) or shRNA targeting METTL3 (shM3#1). Normal rabbit IgG was included as the negative control. (G and H) Expression of METTL3 and HMBOX1 in the control (shCtrl) and METTL3 knockdown (shM3#1 and shM3#2) cells established in Huh-7 (G) and A549 (H). (I and J) mRNA (I) and protein (J) levels of METTL3 and HMBOX1 in the 22Rv1 xenograft model of prostate cancer. P values in (B) were calculated by the Wald test with Benjamini-Hochberg adjustment.
