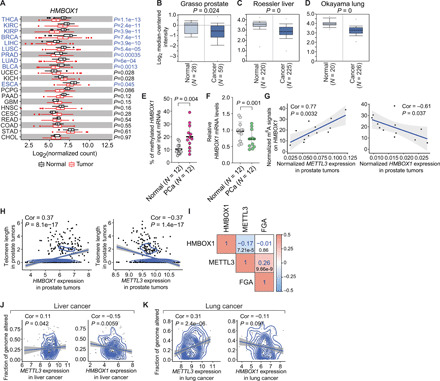
Fig. 7. METTL3 and HMBOX1 are both misregulated in human cancer, which are associated with aberrant signals of m6A modification on HMBOX1, telomere shortening, and altered cancer genome.

(A) HMBOX1 expression in a panel of human tumors and the corresponding normal tissues in TCGA. Cancers that show significant down-regulation of HMBOX1 were highlighted in blue. (B to D) Comparison of HMBOX1 expression between tumors and the corresponding normal tissue counterparts in prostate (B) (15), liver (C) (18), and lung (D) (19) cancer. N, case numbers. (E and F) MeRIP-qPCR analysis of m6A signals on HMBOX1 (E) or RT-qPCR detecting the expression of HMBOX1 (F) in 12 pairs of prostate cancer (PCa) and adjacent normal tissues (Normal). (G) Correlation of m6A signals on HMBOX1 with expression of METTL3 or HMBOX1 in the tumor tissues mentioned in (E) and (F). (H) Correlation between telomere length and expression of HMBOX1 or METTL3 in prostate tumors. (I) Correlation matrix showing correlation among the mRNA levels of METTL3 and HMBOX1 and fractions of altered genome in prostate cancer. Numbers in blue, correlation coefficients. Numbers in black, P values. (J and K) Correlation between the fractions of cancer genome with alterations and expression of METTL3 or HMBOX1 in liver (J) and lung (K) cancer. Correlation coefficients (Cor) were determined by Pearson correlation, and P values in (E) and (F) were calculated by two-tailed paired t test.
