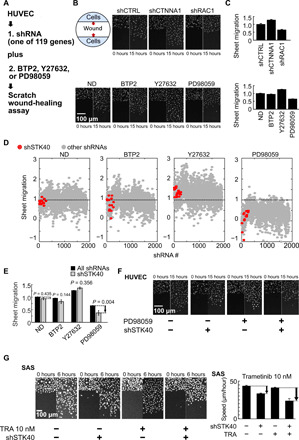
Fig. 1. Two-hit screen revealed STK40-MAPK interaction in sheet migration.

(A) Scheme for the two-hit sheet migration screen. (B) Representative images showing sheet migration of HUVECs treated with shRNAs: shCTRL, shCTNNA1, and shRAC1; and drug inhibitors: ND [no drug; i.e., dimethyl sulfoxide (DMSO)], 2 μM Ca2+ inhibitor BTP2, 5 μM ROCK inhibitor Y27632, and 10 μM MAPK inhibitor PD98059. Hoechst stain marked cell nucleus. (C) Quantification of the sheet migration effects by shRNAs and drugs in (B). (D) Dot plot demonstrates sheet migration effects by individual shRNAs. Red circles resemble shSTK40s, while gray circles resemble other individual shRNAs. (E) Black bars resemble average sheet migration of all shRNAs (n = 1890), while gray bars resemble average sheet migration of shSTK40 (n = 15) upon specific drug treatments. Notice that shSTK40 markedly decreased sheet migration under PD98059. (F) Representative images of shSTK40- and/or PD98059-treated sheet migration in our HUVEC screen. (G) SAS cells treated with shSTK40 and another MAPK inhibitor trametinib (TRA) also revealed synergistic suppression in sheet migration. Left: Representative images. Right: Quantification. Error bars denote means ± SEM. n = 6 biological repeats for each group.
