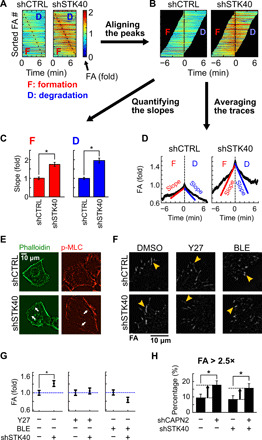
Fig. 3. STK40 knockdown enhanced force-mediated FA formation.

(A to D) Quantification of FA dynamics using SAS cells expressing GFP-tagged PXN. (A) Color maps of FAs sorted by the timing of peak FA signals. (B) Sorted FAs were realigned by the timing of peak signals. (C) Quantification of slopes [derivatives of FA signals over time, depicted in (D)] during FA formation and degradation. (D) Average traces of FA signals based on aligned FA signals in (B). (E) shSTK40 increased the number of stress fibers (labeled by phalloidin) and their overlaying p-MLC in SAS cells. (F) Representative images of FA in SAS cells treated with shSTK40 plus DMSO, 5 μM Y27632 (Y27), or 5 μM blebbistatin (BLE) overnight. (G) Quantification of FA in (F). Note the abolishment of shSTK40 effect by both drugs. (H) Bar graph of the percentage of “huge FAs” in cells treated with STK40 knockdown (shSTK40) and/or calpain knockdown (shCAPN2). Huge FAs were defined as the integrated FA intensity of >2.5× of the average FA signal in shCTRL. Note the increased percentage of huge FAs by shCAPN2 but not by shSTK40. Error bars denote means ± SEM. *P < 0.05.
