
Fig. 5. Source localization at planning and outcome phases.
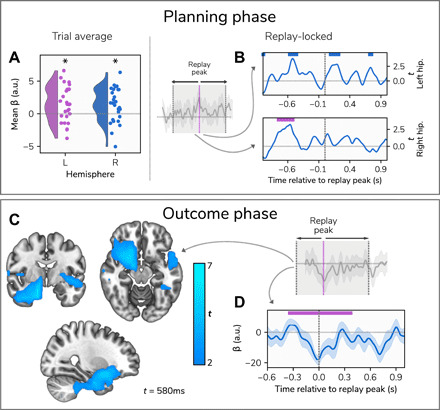
(A) Averaging across the entire trial, generalization trials showed bilateral hippocampal theta power coupled to reactivation strength during the planning phase. The figure shows all participants’ mean β weights across the trial for the effect of reactivation on theta power, which was significantly greater than zero in both hippocampi. *P = 0.01 and 0.02. a.u., arbitrary units. (B) The temporal profile of associations between reactivation strength and hippocampal theta power, within a 2000-ms window centered on the time point where we observed strongest evidence of forward replay (1600 ms following trial onset). The time courses represent the effect of reactivation strength on theta power across the trial, with nonsignificant clusters represented by blue markers above and significant clusters represented by purple markers. (C) Results of the whole-brain analysis in the outcome phase, also performed within a window centered on the time point showing strongest evidence of replay (600 ms following outcome receipt), showing a single significant cluster where theta power was negatively associated with reactivation of the chosen end state (and hence positively associated with reactivation of the unchosen end state). The image is focused on the time point 580 ms after an outcome was displayed. (D) Mean time course of β weights at the peak of the significant whole-brain cluster across the trial, with the replay peak indicated by a vertical dashed line and the temporal extent of the cluster shown in purple.