
Fig. 3. HCV but not HBV infection impairs expression of peroxisomal genes in Huh7.5.1dif cells and liver tissue of patients.
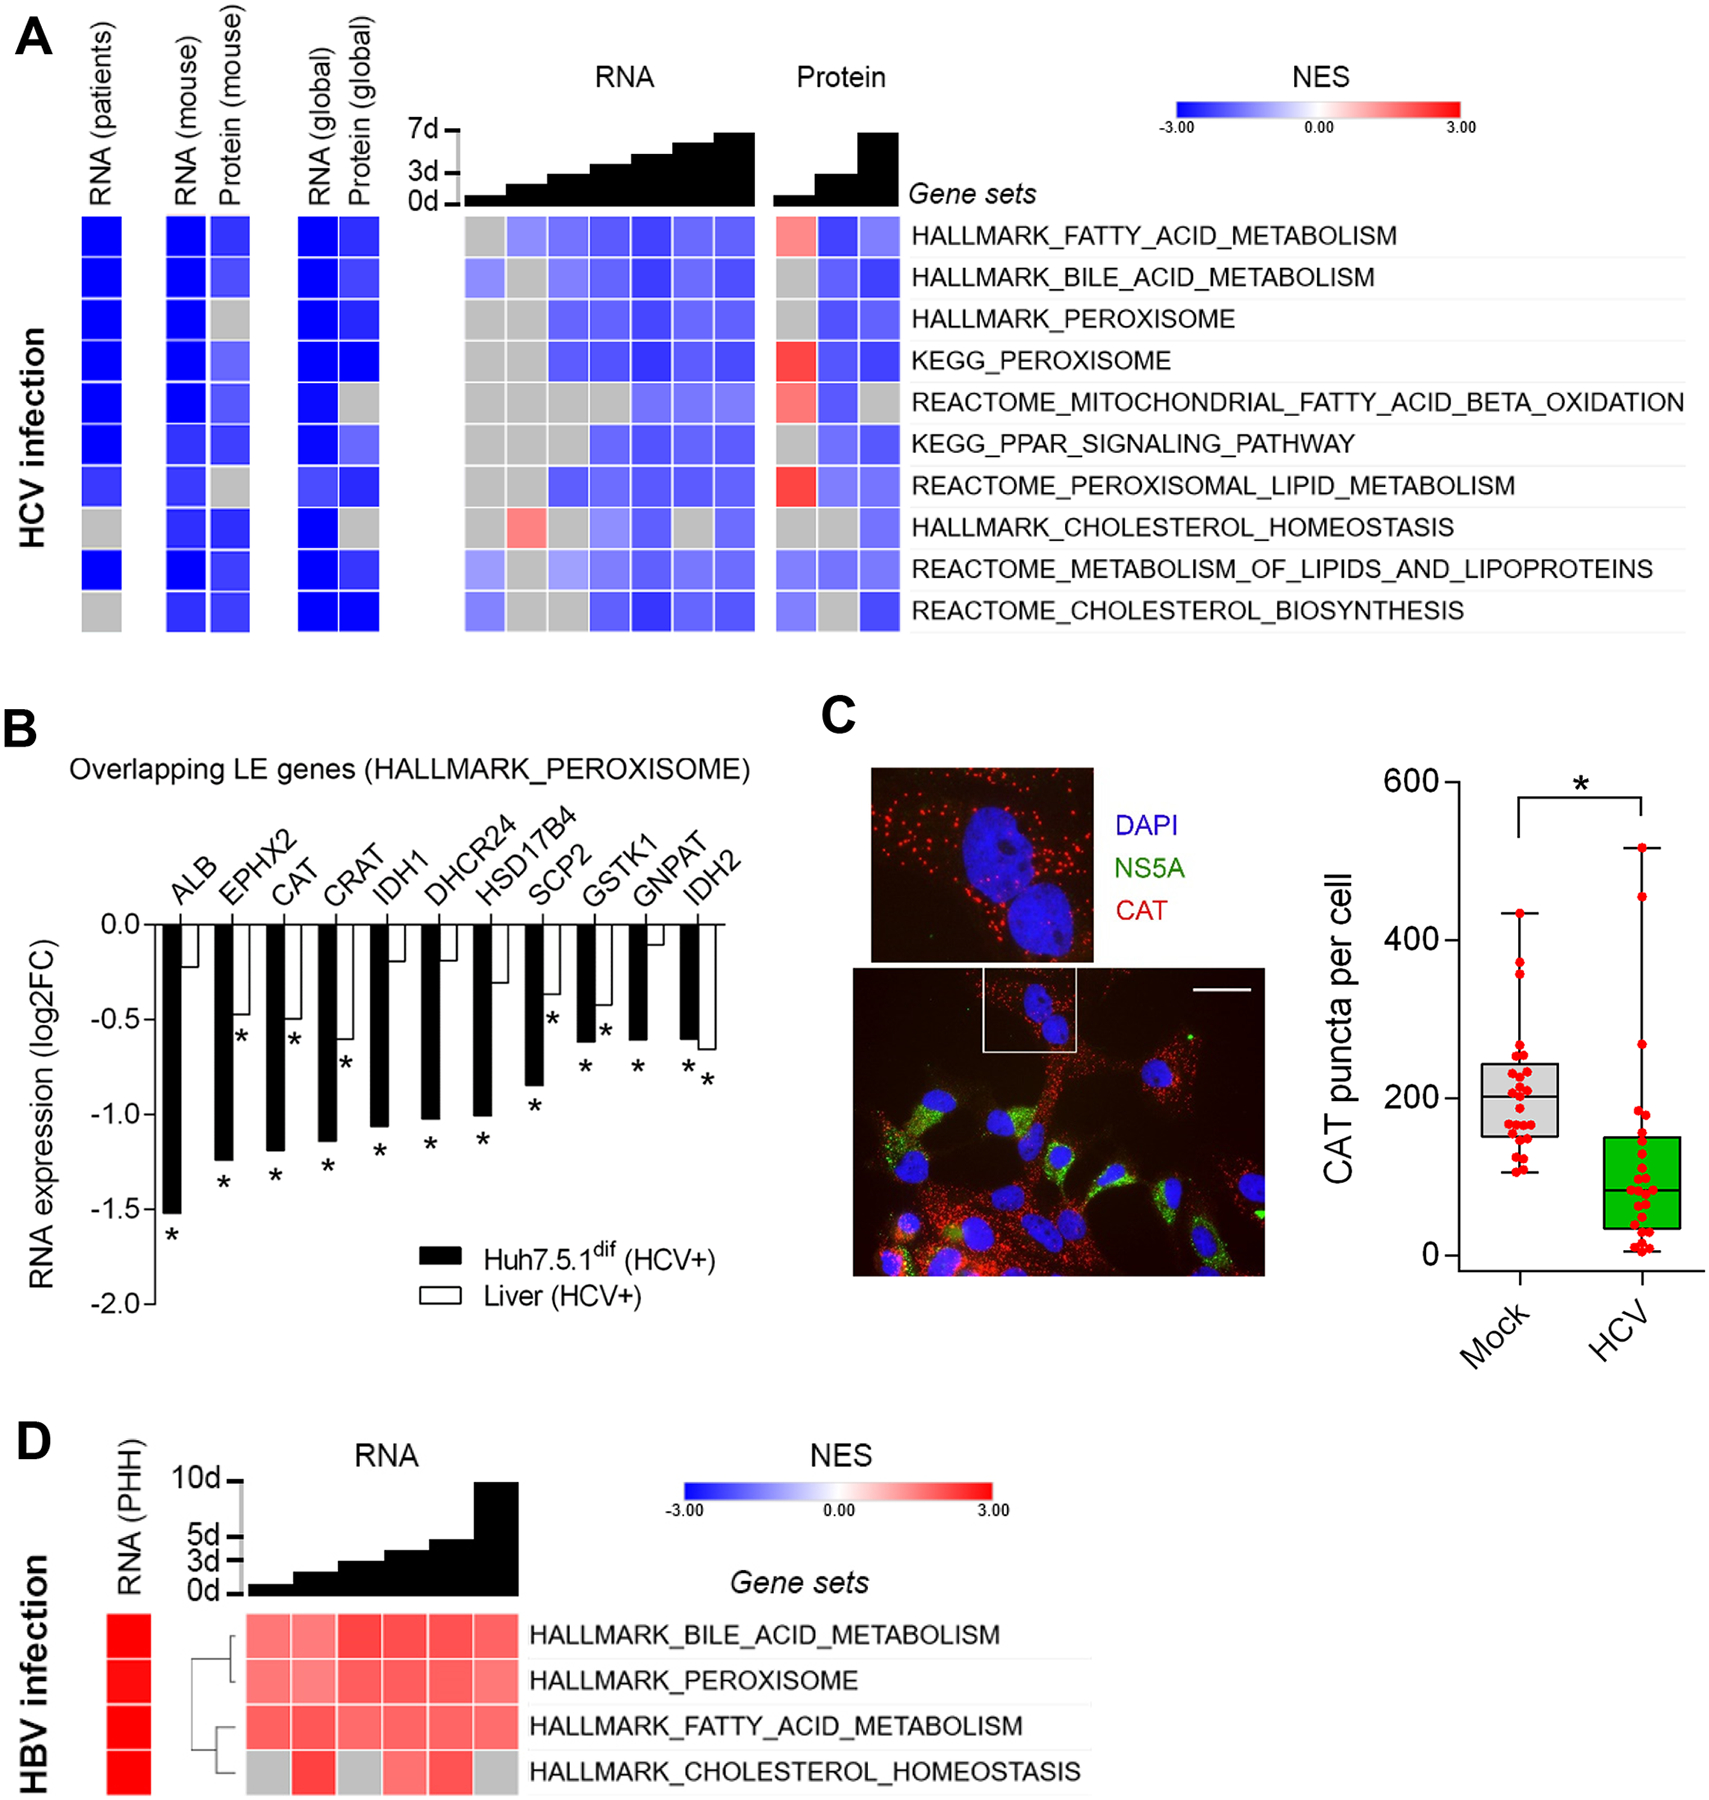
(A) HCV infection impairs metabolic pathways associated to peroxisomal function and lipid homeostasis. GSEA of RNA-Seq data from liver tissue of 25 chronic HCV-infected patients vs. 6 non-infected individuals26, and transcriptomics and proteomics of HCV-infection time-course of Huh7.5.1dif relative to mock-infected cells (n=2). (B) Expression of 11 peroxisomal genes is significantly (p<0.05, Wald test) suppressed by HCV in Huh7.5.1dif and in liver tissue of patients with chronic HCV infection26. Log fold change of leading-edge gene expression of the HALLMARK_PEROXISOME gene set (A). (C) Peroxisome marker expression is significantly (p=0.0048, T-Test) perturbed in HCV-infected hepatocyte-like cells. Immunofluorescence microscopy of Huh7.5.1dif cells infected for 3 days with HCVcc. The peroxisomal marker catalase (CAT) is stained in red, nuclear DNA (DAPI) in blue and HCV (NS5A) in green (see also supplementary Fig. S5). Quantification of catalase-stained peroxisomes in 25 random HCV-infected cells and 25 mock cells is shown in box/whiskers; bar represents 200 μm. (D) HBV infection promotes peroxisome function. GSEA of transcriptomics of HBV-infection of HepG2-NTCP for 10 days (n=3), and primary human hepatocytes (n=3) infected for 40 days with HBV (genotype D) (GSE69590). NES are displayed in red (increased), blue (decreased), and gray (no significant change). Temporal analysis of infected Huh7.5.1dif are presented as global trend (global) and individual timepoints. Statistical cut-off for GSEA of liver tissues was FDR q<0.05 and for Huh7.5.1dif p<0.005.