
Figure 3.
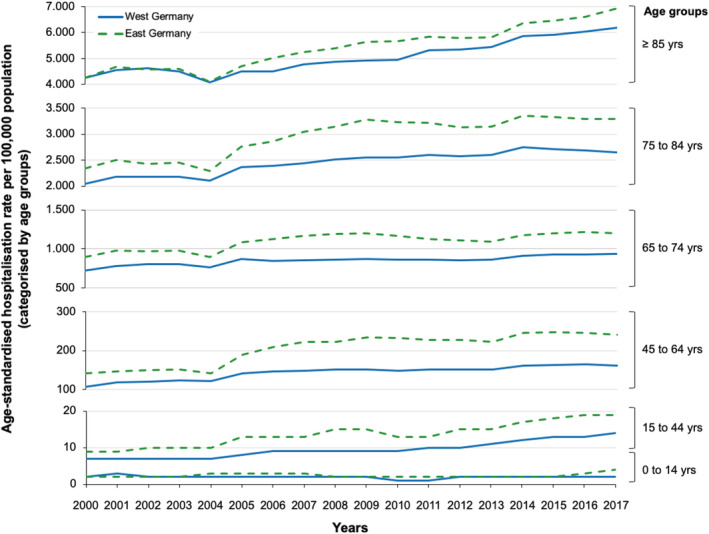
Heart failure‐related hospitalizations from 2000 to 2017 by age groups. Displayed is the age‐standardized rate of hospitalizations due to heart failure per 100 000 population in West and East Germany stratified by age groups. Solid lines denote values for West Germany and dotted lines for East Germany. Please note different scaling on the ordinates.