
Figure 3.
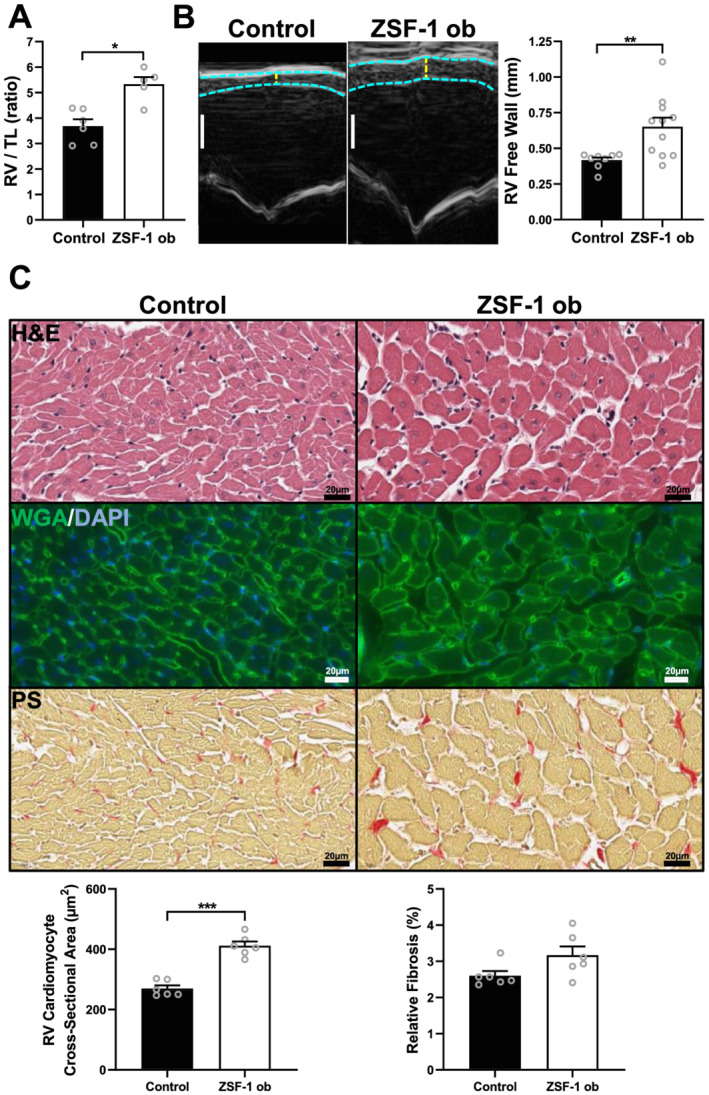
ZSF‐1 obese rats exhibit right ventricular hypertrophy. (A) Gravimetric ratio of RV weight to tibia length (TL); n = 5–6 per group. (B) Representative right ventricular (RV) M‐mode images depicting increased RV free wall thickness with quantification and n = 8–11 per group; scale bar = 1 mm. (C) Representative haematoxylin/eosin (H&E), wheat‐germ agglutinin/DAPI (WGA/DAPI), and picrosirius red (PS) staining images with RV cardiomyocyte cross‐sectional area (CSA) and relative fibrosis quantification; n = 6 per group with 100 cells being measured per data point/animal for CSA assessment and five images of the RV free wall were evaluated per data point/animal for fibrosis analysis. Control, Wistar Kyoto rats; ZSF‐1 ob, ZSF‐1 obese. Data are presented as mean ± standard error of the mean; statistics were performed by Mann–Whitney test or unpaired t‐test with *P < 0.05, **P < 0.01, ***P < 0.005.