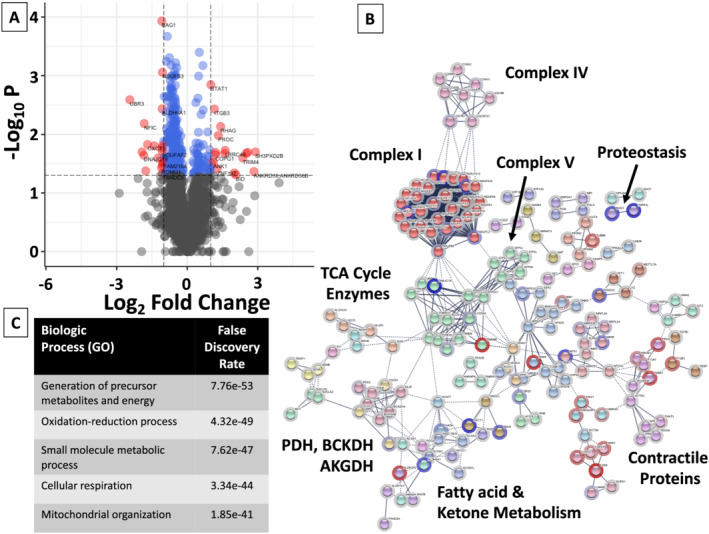
Figure 3.

Volcano plot, network map, and biologic enrichment of proteins significantly different between HFpEF and HTN participants. (A) Volcano plots were constructed with blue dots representing proteins with significantly different relative levels between HFpEF and HTN participants (P < 0.05), and red dots and the gene names listed for proteins that had significantly different levels with an absolute log2 fold‐change (FC) > 1. (B) All proteins with significantly different relative levels between HFpEF and HTN participants (P < 0.05), and their log2 fold‐change (FC), were entered into the String Database (string-db.org). Interrelated proteins are displayed along with the connection between proteins and groups. Related proteins are shaded a similar colour. The halo around each protein represents the log2 FC, with blue indicating a relative decrease in protein level in HFpEF participants as compared with HTN participants, and red representing an increase. Although not inclusive, specific clusters of proteins related to energy fuel metabolism are enumerated. (C) Enrichment of the top 5 biologic (GO) processes, along with the false‐discovery rate are listed. AKGDH, alpha‐ketoglutarate dehydrogenase complex; BCKDH, branched‐chain alpha‐keto dehydrogenase complex; PDH, pyruvate dehydrogenase; TCA, tricarboxylic acid cycle.
