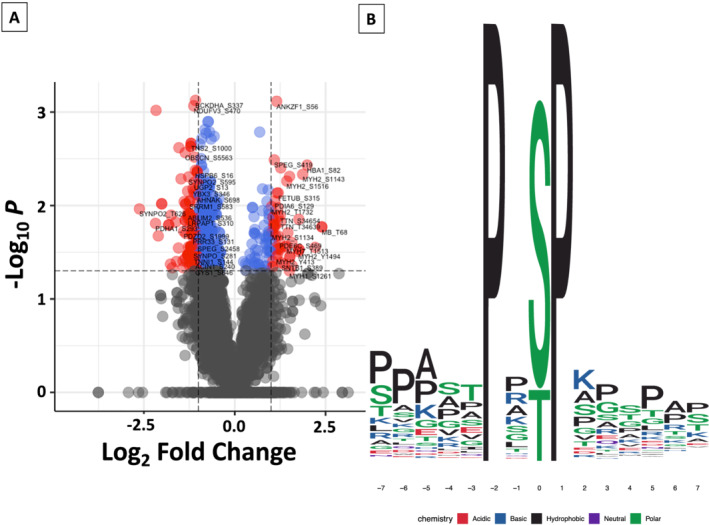
Figure 5.

HFpEF vs. HTN muscle biopsy samples demonstrate relative differences in the phosphoproteome. The volcano plot (A) compares the differences in the relative levels of specific phosphopeptides, identifying differences in 522 phosphopeptides (P < 0.05 for each). Blue dots represent peptides with significantly different relative levels (P < 0.05); whereas, red dots indicate peptides with significantly different relative levels and an absolute log2 fold‐change >1. Peptides and the site of phosphorylation are listed. In (B), kinase motif analysis using the human phosphopeptide proteome as a reference identified increased enrichment for a P‐X‐(S/T)‐P motif in HTN as compared with HFpEF SkM. This motif is recognized by ERK1/ERK2, among other kinases.
