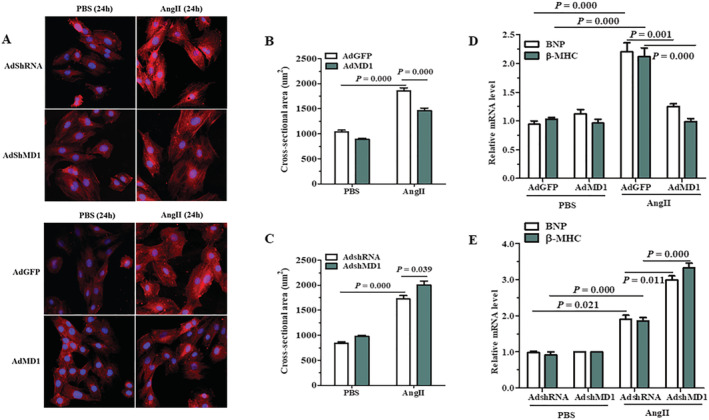
Figure 3.

Effects of MD1 on cardiomyocyte hypertrophy in vitro. (A) Representative images of H9C2 cells infected with AdshRNA or AdshMD1, as well as AdGFP or AdMD1, in response to Ang II. (B,C) Quantitative results of CSA in the indicated groups. More than 100 cells were analysed for each group. (D,E) Expression of the hypertrophic markers was determined by qRT‐PCR in H9C2 cells infected with AdGFP or AdMD1 (D) and AdshRNA or AdshMD1 (E) following treatment with PBS or Ang II for 3 h. n = 3, P‐values are shown above the connection lines between compared columns.
