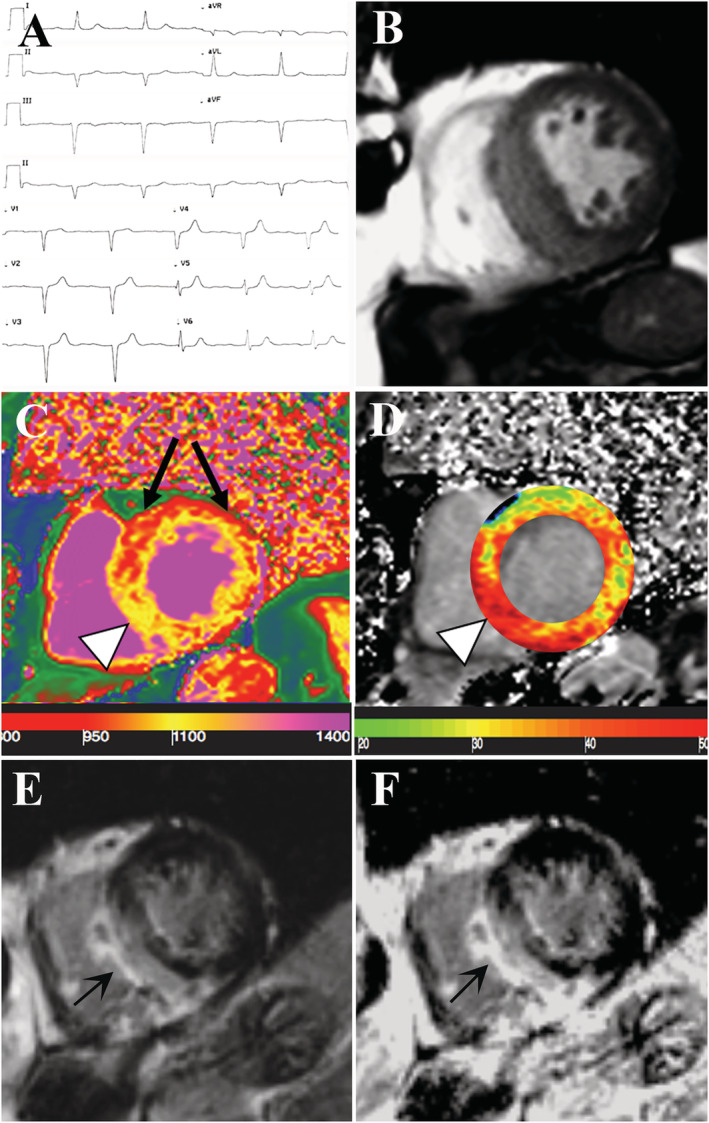
Figure 1.

Non‐invasive evaluation of the 85‐year‐old patient with suspected TTR cardiac amyloidosis. (A) Electrocardiogram showing a 1st degree atrioventricular block, a left anterior fascicular block and normal voltages. (B–F) CMR images in short axis view. CineMR image (B) demonstrates severe left ventricular (LV) hypertrophy. Native T1 (nT1) map (C) showing an increase in the myocardial T1 value at the inferior septum (arrowhead, nT1 = 1130 ± 25 ms, high value relative to the scanner normal range = 970–1030 ms) and at the inferior wall (nT1: 1080 ± 34 ms, slightly increased) while the anterior and antero‐lateral wall (black arrows) remained within normal limits (nT1 between 980 and 1005). On extracellular volume fraction (ECV) map (D) the area of high nT1 corresponded to increased ECV (arrowhead). Late gadolinium enhanced (LGE) image with magnitude reconstruction (E) and with phase‐sensitive inversion recovery reconstruction (PSIR, F) showing extensive area of non‐ischemic LGE involving the area of LV hypertrophy and also the inferior right ventricle wall. There is concordance between myocardial T1 (nT1 and T1 map) and both LGE images.
