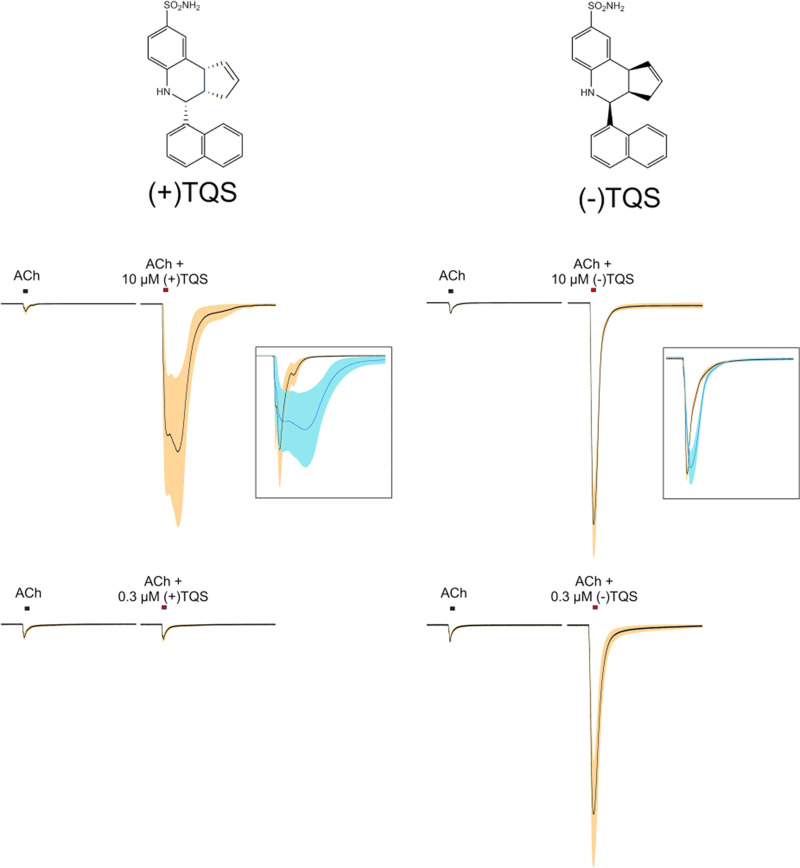
Fig. 7.
TQS isomers. Shown on top are the structures of the two isomers of TQS (Stokes et al., 2019). The upper traces are averaged normalized responses (±S.E.M.) of oocytes expressing human α7 to 60 µM ACh or 60 µM ACh coapplied with 10 µM (+)TQS or (−)TQS (n equal to 3 and 4, respectively). The lower traces are averaged normalized responses (±S.E.M.) of oocytes (n = 8) expressing human α7 to 60 µM ACh or 60 µM ACh coapplied with 0.3 µM (+)TQS or (−)TQS. The data for the 0.3 µM responses have previously been published in bar graph format (Stokes et al., 2019).

