. 2021 Jul 28;10:e70322. doi: 10.7554/eLife.70322

Figure 1. Histological analysis of testicular tubules of C57BL/6 offspring after prenatal di(2-ethylhexyl) phthalate (DEHP) exposure.

(A, B) Representative images of testicular tubules in F1 (A) and F2 (B). Abnormal testicular tubules were categorized as ‘Type A’ (presence of various size of vacuoles; indicated by arrows), ‘Type B’ (no lumen and complete loss of germ cell organization), or ‘Type C’ (presence of dead cells; indicated by arrowheads). Type A was further classified into three subtypes as described in Results. Enlarged images corresponding to the rectangular areas in Type A (small vacuoles-3) are shown. Arrows indicate nuclei. Active caspase-3 immunoreactive apoptotic cells (green) are indicated by arrowheads in a picture on the right of the Type C picture. (C) Ratios of abnormal tubules in F1 and F2 animals (F1 oil as vehicle control: n = 4; F1 DEHP: n = 5; F2 oil: n = 6, F2 DEHP: n = 8). (D) Ratios of abnormal tubule types in F1 and F2. **p<0.01 (unpaired two-sided Student's t-test). Scale bars: 50 μm.

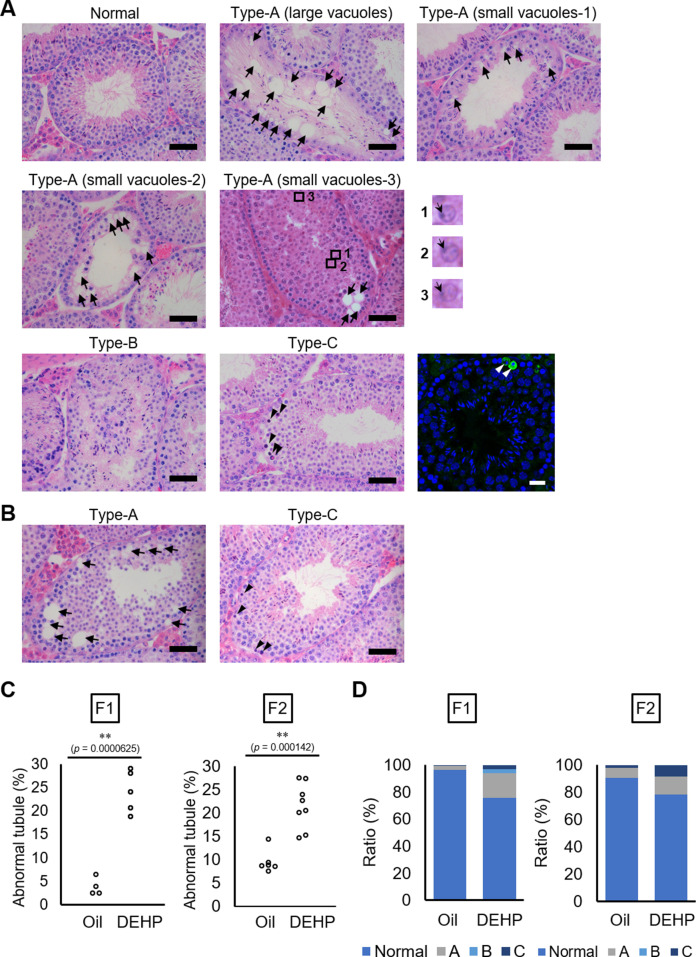
Figure 1—source data 1. Numerical source data of abnormal testicular tubule rates (Figure 1C) and ratios of abnormal tubule types (Figure 1D), and data for Kolmogorov–Smirnov test for Figure 1C.

Figure 1.

Figure 1—figure supplement 1. Histological analysis of the testicular tubules of prenatally di(2-ethylhexyl) phthalate (DEHP)-exposed offspring from C57BL/6 females mated with Oct4-deltaPE-GFP transgenic males.

Figure 1—figure supplement 1.

(A, B) Representative images of testicular tubules in F1 (A) and F2 (B). Abnormal testicular tubules were categorized as ‘Type A’ (presence of various size of vacuoles; indicated by arrows) and ‘Type C’ (presence of dead cells; indicated by arrowheads). ‘Type B’ (no lumen and complete loss of germ cell organization) abnormal tubules were very rare in F1 and absent in F2. Arrowheads indicate apoptotic cells. (C) Ratios of abnormal tubules in F1 and F2 testes (F1: n = 3; F2: n = 4). (D) Ratios of abnormal tubule types in F1 and F2. (E) Representative histology of testis from oil- or DEHP-treated E19.5 embryos. Multinucleated cells are indicated by arrowheads. (F) Quantification of the multinucleated cell number per section. Values are plotted as mean ± SEM of all serial sections from one testis in each of three independent embryos. **p<0.01 (unpaired two-sided Student's t-test). Scale bars: 50 μm.
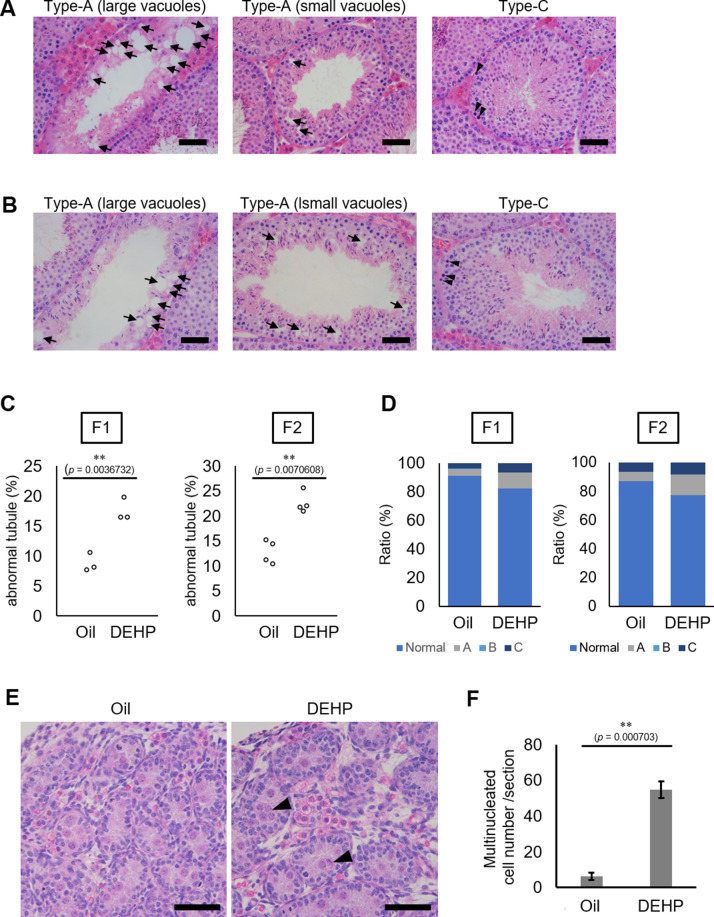
Figure 1—figure supplement 1—source data 1. Numerical source data of abnormal testicular tubule rates (Figure 1—figure supplement 1C), ratios of abnormal tubule types (Figure 1—figure supplement 1D), and multinucleated cells (Figure 1—figure supplement 1F), and data for Kolmogorov–Smirnov test for Figure 1—figure supplement 1C, F.