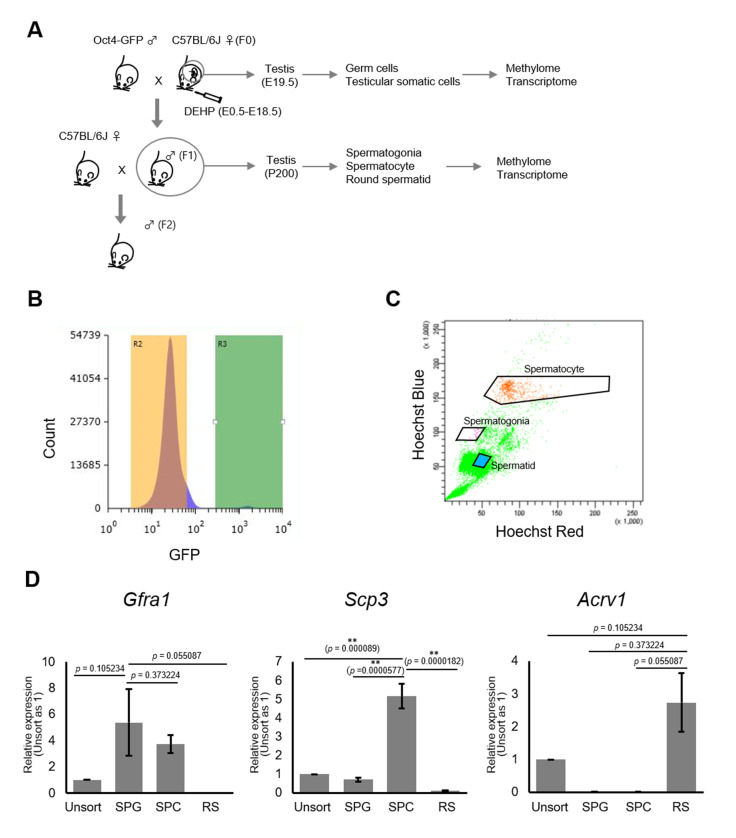
Figure 2. Purification of germ cells from E19.5 and adult testis.
(A) The bleeding schema of the experiments. (B) A representative FACS histogram of E19.5 testis. GFP-positive germ cells in the R3 gate (green color), and GFP-negative testicular somatic cells in the R2 gate (yellow color), were collected. (C) A representative FACS plot of F1 testicular cells stained with Hoechst 33342. Gates for spermatogonia, spermatocytes, and round spermatids are indicated. (D) Relative expression of stage-specific germ cell marker genes in F1 sorted cells was determined by RT-qPCR and consisted of the following: Gfra1 for spermatogonia, Scp3 for spermatocytes, and Acrv1 for spermatids. SPG: spermatogonia; SPC: spermatocytes; RS: round spermatids. Values were plotted as mean ± SEM of each cell sample from six individuals of F1. Statistics for data in (D) was unpaired two-sided Student's t-test.

