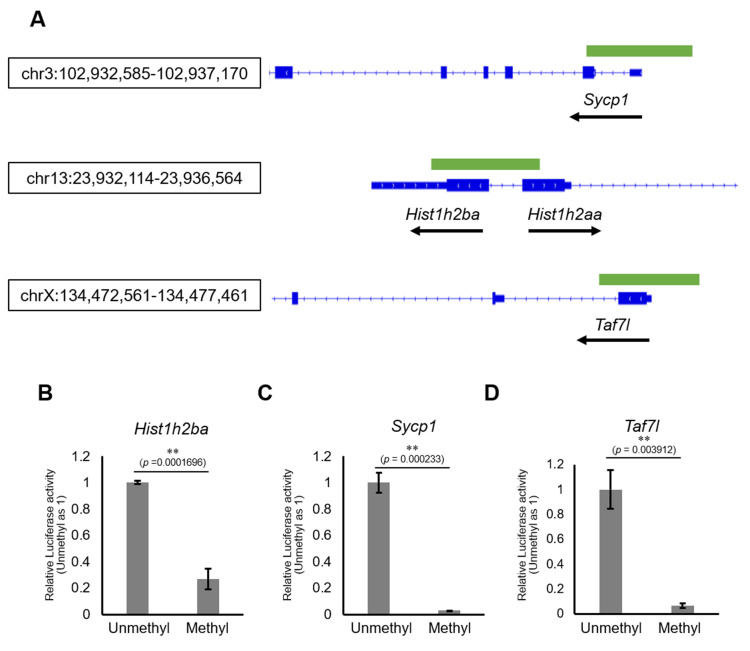
Figure 6. The effects on gene expression of promoter methylation in the candidate epi-mutated loci.
(A) Gene structures of Hist1h2ba, Sycp1, and Taf7l. Exons are indicated by blue bars, and the promoter regions (defined as ± 500 bp from transcription start site) used for firefly luciferase (Luc) assays are indicated by green bars. (B–D) The Luc activity of the reporter vector with either methylated or unmethylated promoters of Hist1h2ba (B), Sycp1 (C), and Taf7l (D) in HEK293T cells. Luc activity generated by the indicated vector was normalized to that generated by the Renilla phRL-TK vector. The Luc activity by the unmethylated vectors was defined as 1.0. Values are plotted as mean ± SEM of three independent experiments (n = 3). **p<0.01 (unpaired two-sided Student's t-test).

