. 2021 Jul 19;10:e66657. doi: 10.7554/eLife.66657

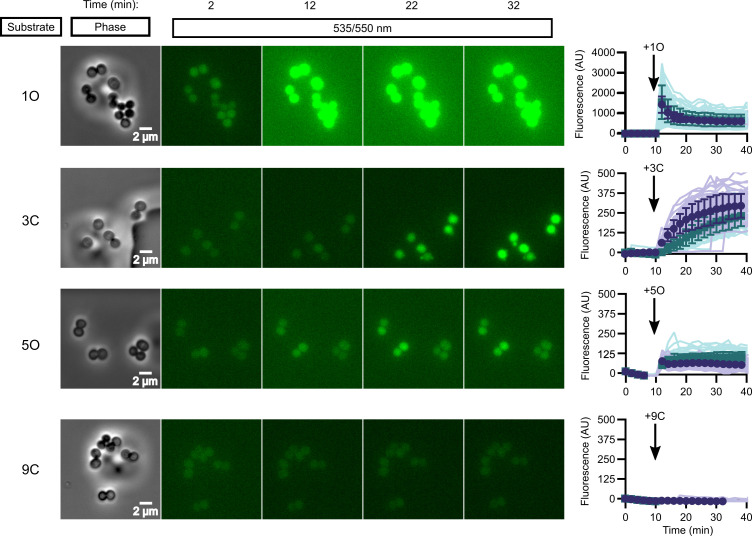
Figure 3. In vivo activation rates depend on ester promoiety selection.

Time series of activation of various fluorogenic substrates (Figure 3—figure supplement 1). Substrates were added into the microfluidics chamber at t = 10 minutes. On the right, quantification of individual cell or cell cluster fluorescence per area. Faint traces are individual cells and darker traces represent the mean of a given experiment. Each experiment was performed in biological duplicate, and each experiment is displayed in a different color (purple or green). Full movies viewable as Videos 14. Error bars denote SD.

Figure 3—source data 1. (1) Michaelis–Menten parameters for SaFrmB.
Displayed are the results of three independent biological replicates in technical duplicate. (2) Michaelis–Menten parameters for SaGloB. Displayed are the results of three independent biological replicates in technical duplicate.

Figure 3.

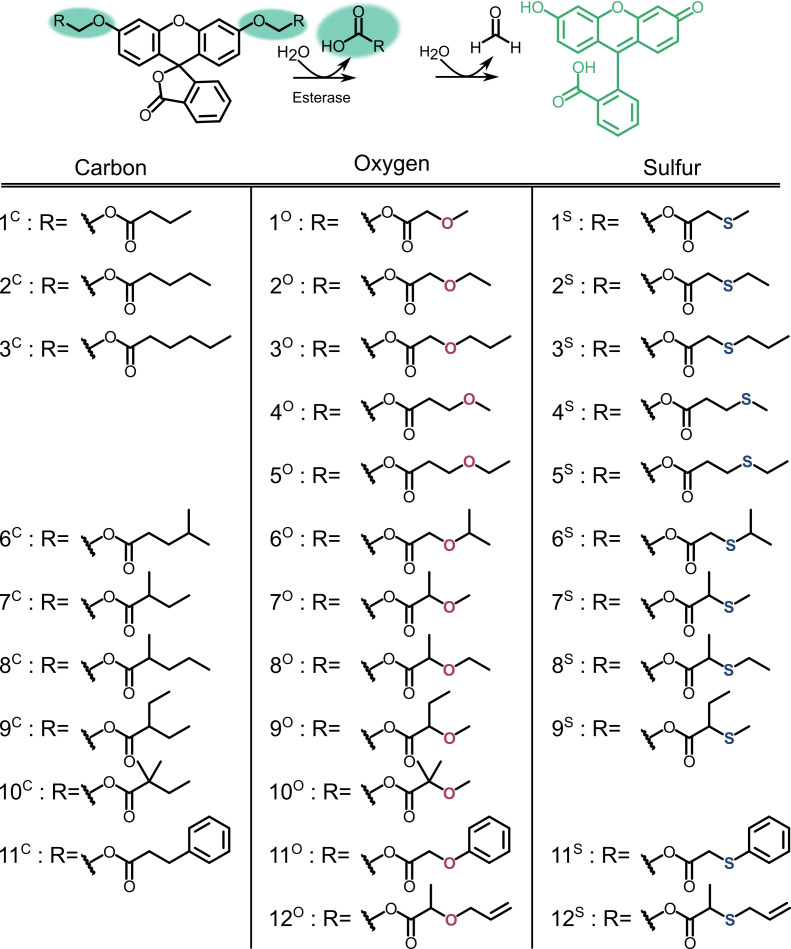
Figure 3—figure supplement 1. Profluorescent substrate library.

Figure 3—figure supplement 1.

Activation of substrates via esterase action results in fluorescence.
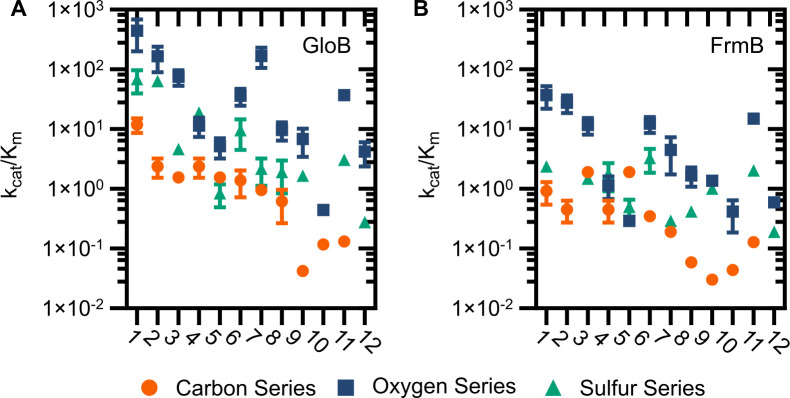
Figure 3—figure supplement 2. Catalytic efficiency of GloB (A) and FrmB (B).

Figure 3—figure supplement 2.

Numbers correspond to the structures displayed in Figure S5, compounds in the carbon series denoted in orange, oxygen series in blue, and sulfur series in green.