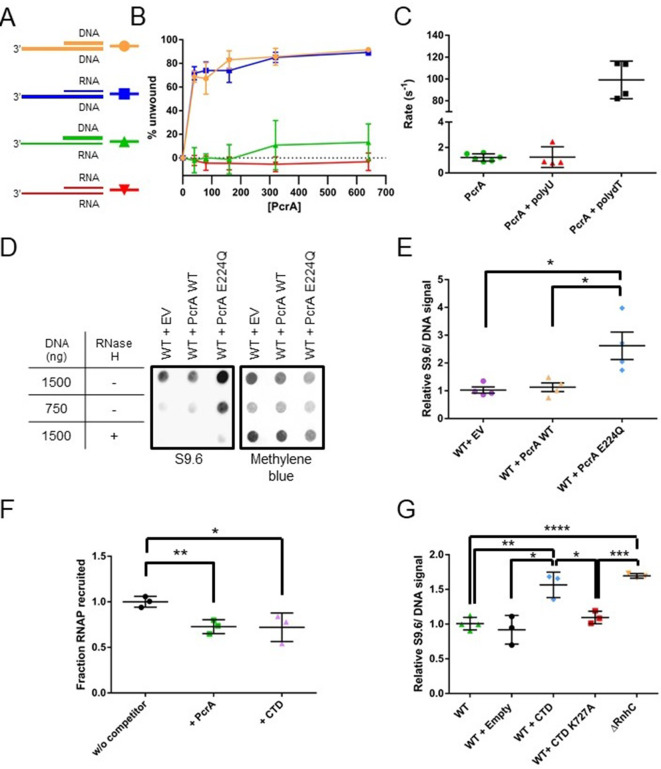
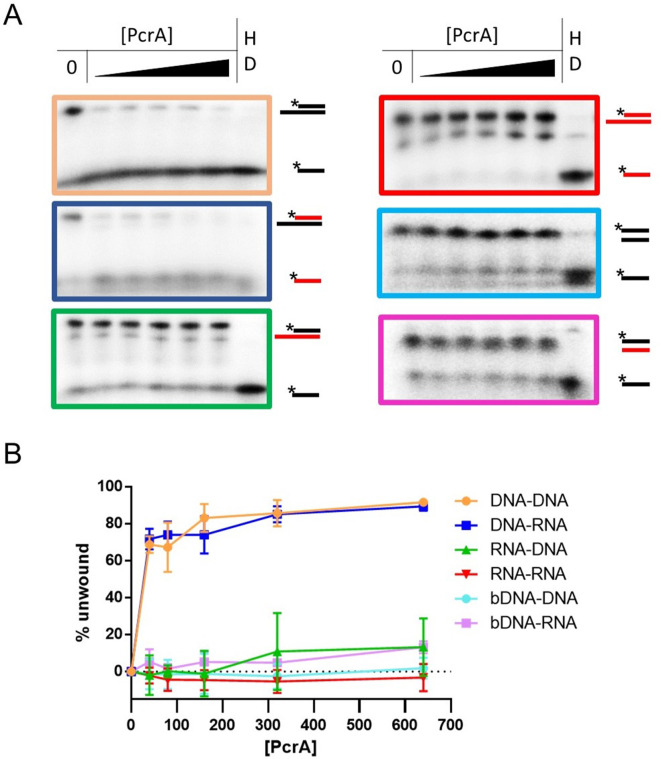
Figure 6. PcrA unwinds DNA-RNA hybrids in vitro and supresses R-loops in vivo (A) DNA and RNA substrates used for helicase assays.
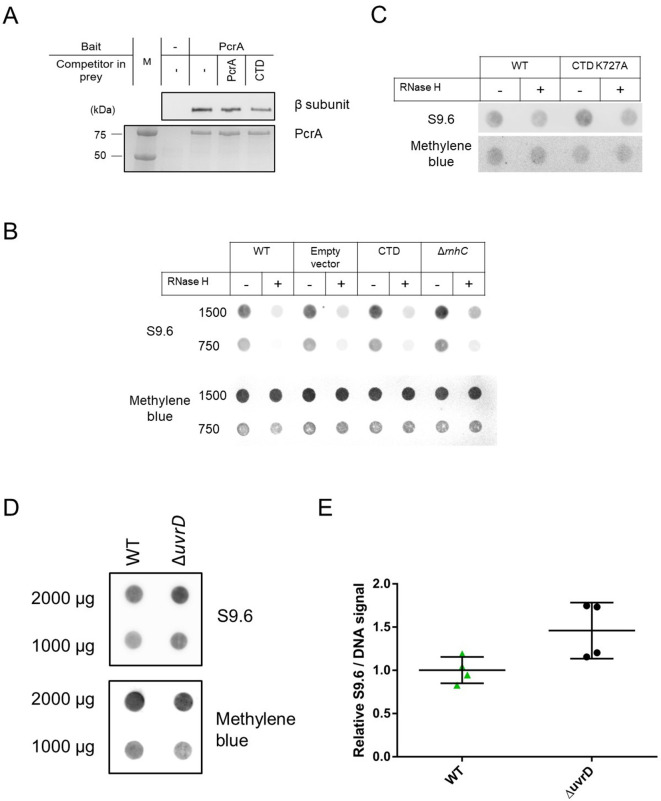
Thick lines represent DNA strands and thin lines, RNA strands. The oligonucleotides used to form these substrates are shown in Table 7. (B) Quantification of unwinding as a function of PcrA concentration (in nM) for the 3′-tailed substrates shown in panel A. The substrate is only efficiently unwound if the longer of the two nucleic acids strands is DNA. Error bars show the standard deviation of at least three independent experiments. (C) The ATPase activity of PcrA is strongly stimulated by single-stranded DNA but not single-stranded RNA. Error bars show the standard deviation of at least three independent experiments. (D) Anti R-loop antibody (S9.6) dot blot for nucleic acid samples purified from three strains of B. subtilis. These strains contain an integrated expression cassette for either wild-type PcrA or a dominant negative form of PcrA (E224Q). The control strain (EV) contains an integrated but empty expression cassette. The S9.6 signal is normalised using methylene blue as a stain for all DNA. Note the high S9.6 signal for the strain expressing PcrA E224Q. (E) Quantification of four independent repeats of the experiment shown in (c). Error bars show the SEM. Expression of a dominant negative form of PcrA increases R-loop content (relative to DNA) in B. subtilis by ~2.5 fold. (F) Quantification of pulldown experiments of RNAP from B. subtilis cell extracts using biotinylated PcrA as bait and supplemented with purified PcrA WT or CTD. Addition of the CTD competes with WT PcrA to bind to RNAP. Error bars show the SEM of three independent repeats. (G) Relative R-loop levels in strains of B. subtilis expressing free CTD, a CTD mutant that interacts weakly with RNAP, or with a control expression cassette. A ΔrnhC strain is shown as a control for elevated R-loop levels. Error bars show the SEM of at least three independent experiments. In all panels, the statistical significance was determined using two-tailed Student’s t test (*p value < 0.05, **p value < 0.01, ***p value < 0.001, ****p value < 0.0001).


