. 2021 Jul 28;10:e65824. doi: 10.7554/eLife.65824

Figure 7. Steered MD simulations.

(A) RMSD change with respect to the active and Src-like inactive conformation during the SMD simulation of the A763-Y764insFQEA EGFR. The SMD simulation was initiated from the active conformation (yellow) and streered toward the Src-like inactive conformation (orange). (B) Superposition of the final frame of the SMD simulation with the initial and target conformation. Same SMD simulations were run for each system prior to the PTmetaD to confirm that the designed contact maps can drive the active to Src-like inactive transition and vice-versa with similar results (data not shown).

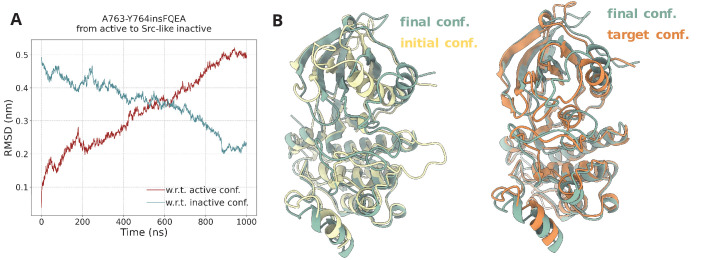
Figure 7.

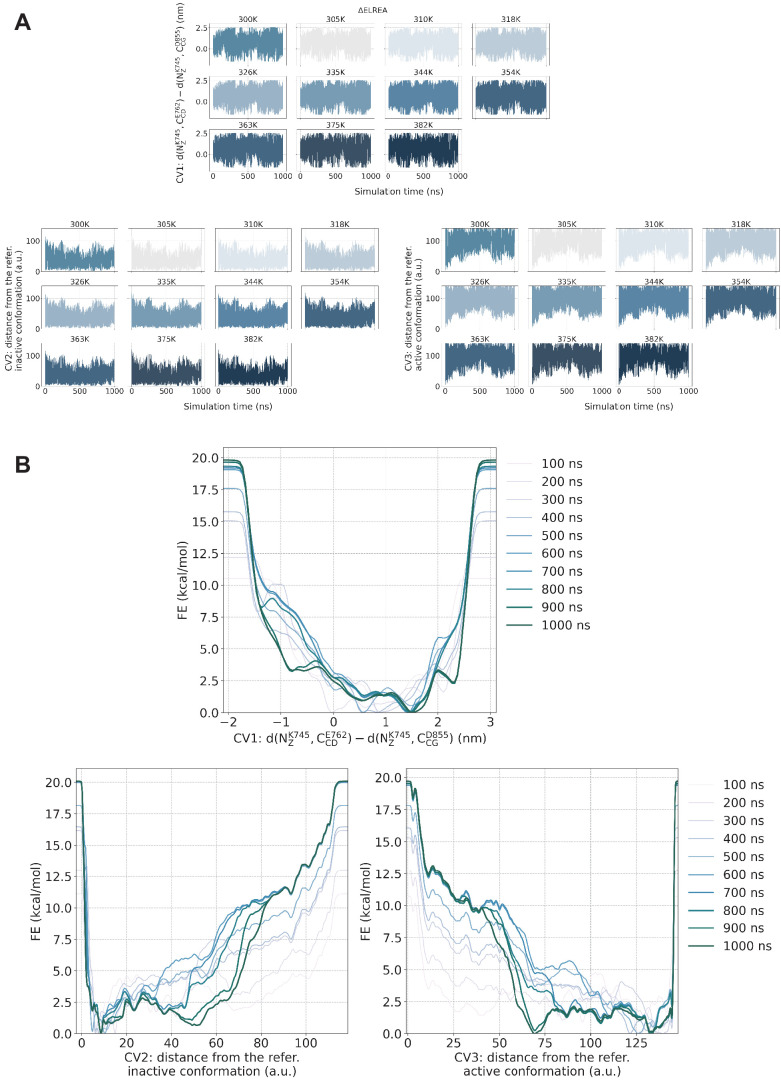
Figure 7—figure supplement 1. PTmetaD simulations convergence check.

Figure 7—figure supplement 1.

PTmetaD simulations convergence check for the ΔELREA-EGFR. (A) Time series per replica of the three CVs that were biased during the PTmetaD simulation. Following the progression of the predefined CVs over time, one can assess whether the system gets stuck to any specific region of the CV phase space. (B) Estimate of the free energy as a function of the simulation time. At convergence, the reconstructed profiles should be similar. Similar behavior was observed for the rest of the examined mutants.
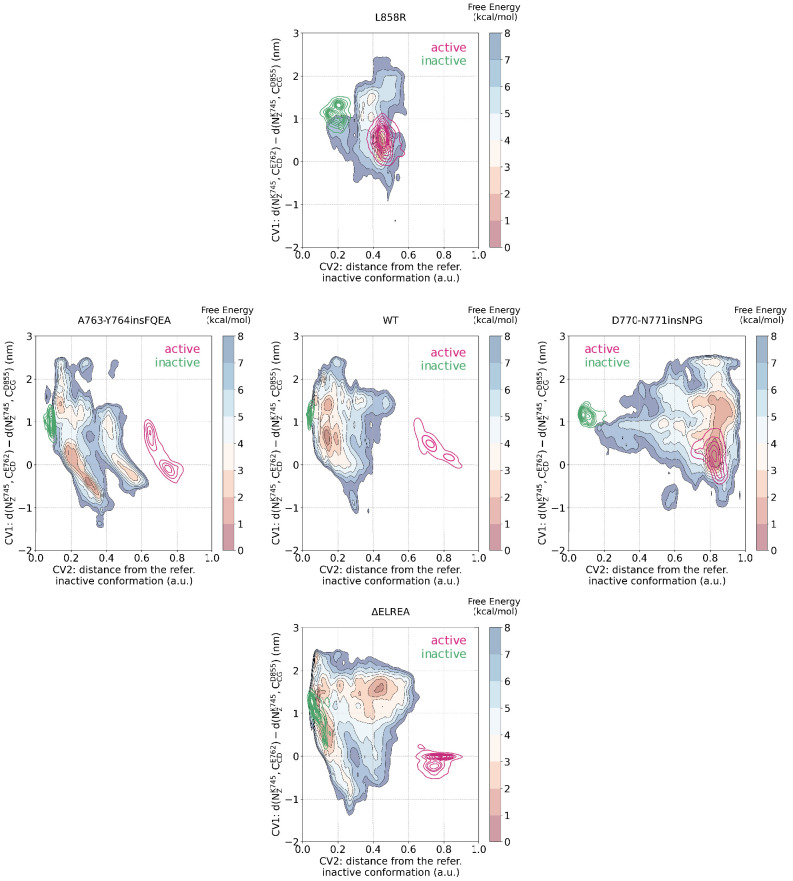
Figure 7—figure supplement 2. Mapping of the CV spaced sampled during the unbiased simulations to the PTmetaD simulations.

Figure 7—figure supplement 2.

Mapping of the conformational space sampled during the unbiased simulations of the monomeric EGFR to the space sampled during the PTmetaD simulations as projected to two out of the three CVs that were biased during the PTmetaD. The portion of the space that was sampled by unbiased simulations starting from the active conformation are shown in magenta, while the space sampled during simulations starting from the Src-like inactive conformation are shown in green.
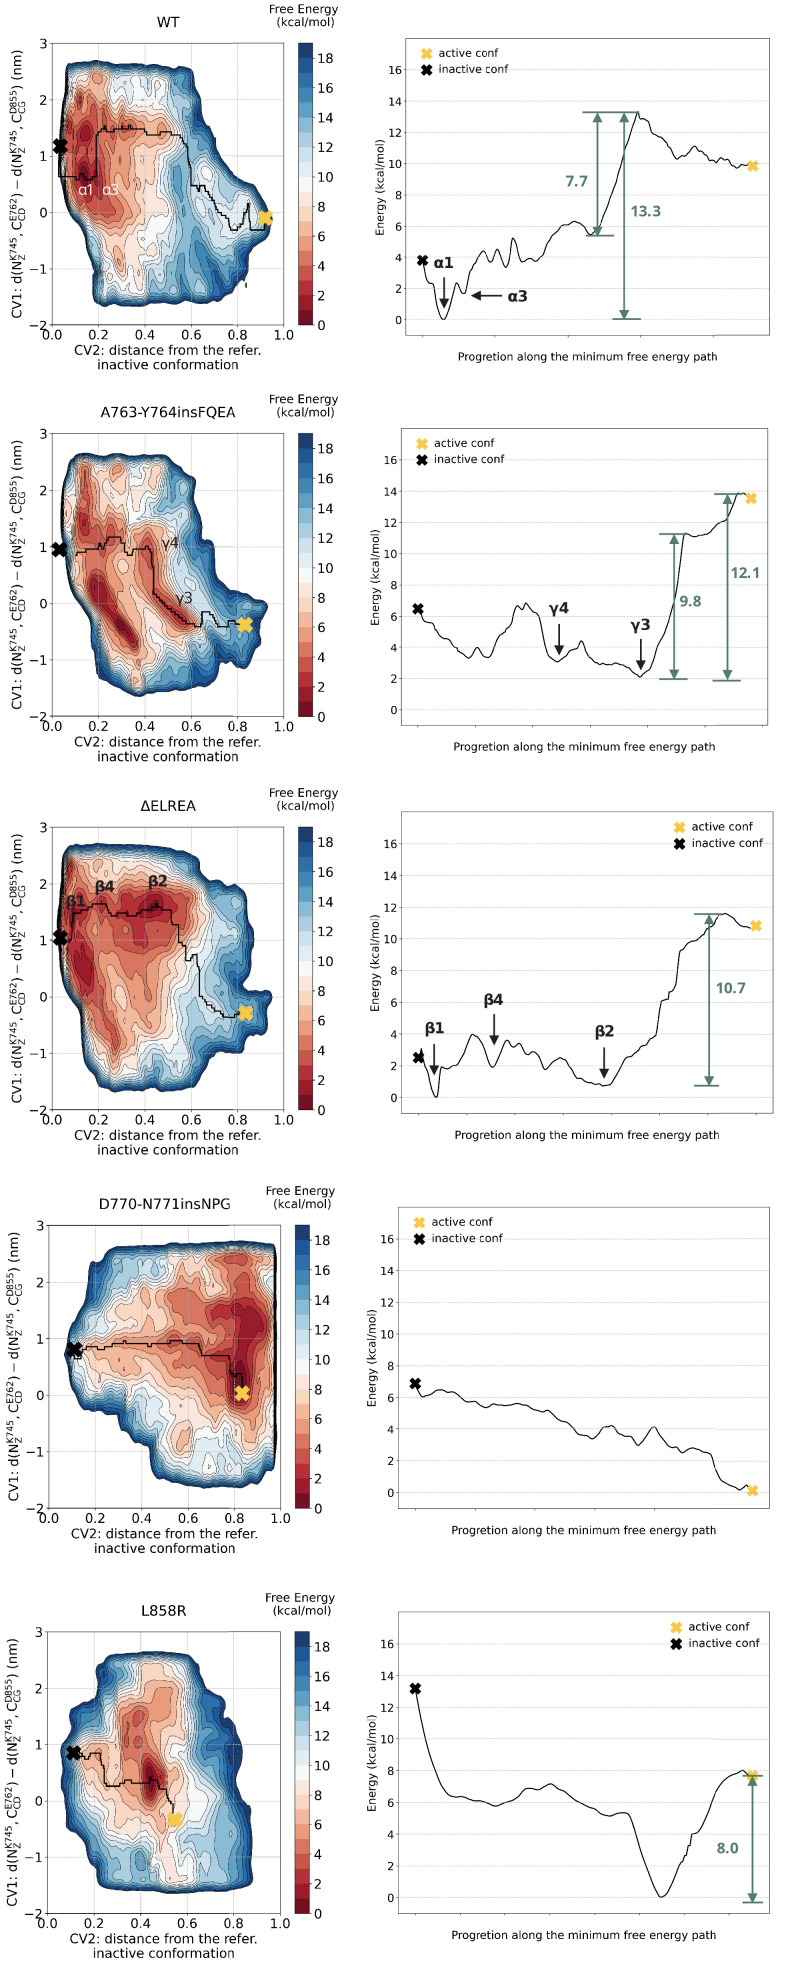
Figure 7—figure supplement 3. Minimum energy path.

Figure 7—figure supplement 3.

Minimum energy path connecting the active to Src-like inactive conformation.
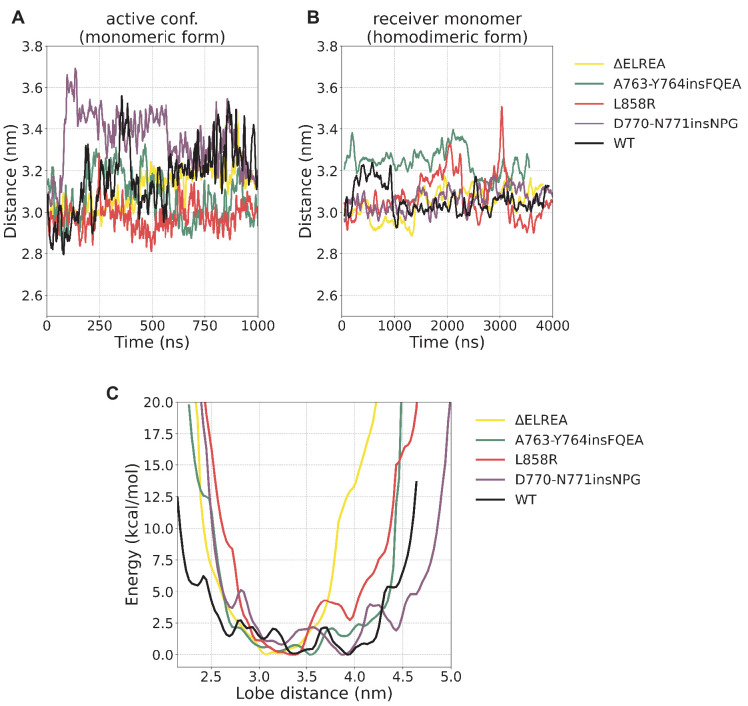
Figure 7—figure supplement 4. N/C-lobe separation.

Figure 7—figure supplement 4.

N/C-lobe separation (A) during the unbiased simulations of the monomeric form starting from the active conformation, (B) the receiver monomer during the unbiased simulations of the homodimeric form, and (C) the reprojection of the free energy from the PTmetaD on this distance. The calculated lobe distance corresponds to the distance between V786 (N-lobe, WT residue numbering) and T903 (C-lobe, WT residue numbering).
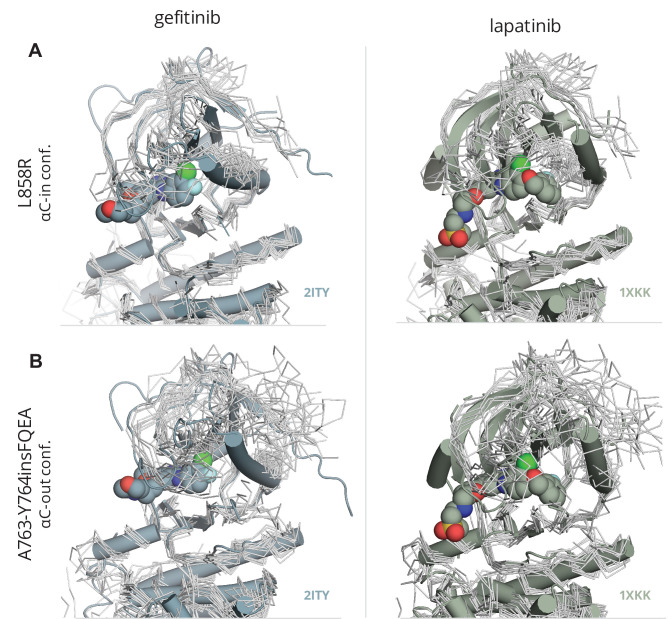
Figure 7—figure supplement 5. Fitting of gefitinib and lapatinib to L858R and A763-Y764insFQEA.

Figure 7—figure supplement 5.

Ensemble of conformations from the PTmetaD simulations of the activating mutant (A) L858R and (B) A763-Y764insFQEA in the αC-in and αC-out conformations depicted in gray tubes and superimposed with the crystal structures of the WT-EGFR (PDB ID: 2ITY) bound with gefitinib and lapatinib (PDB ID: 1XKK).