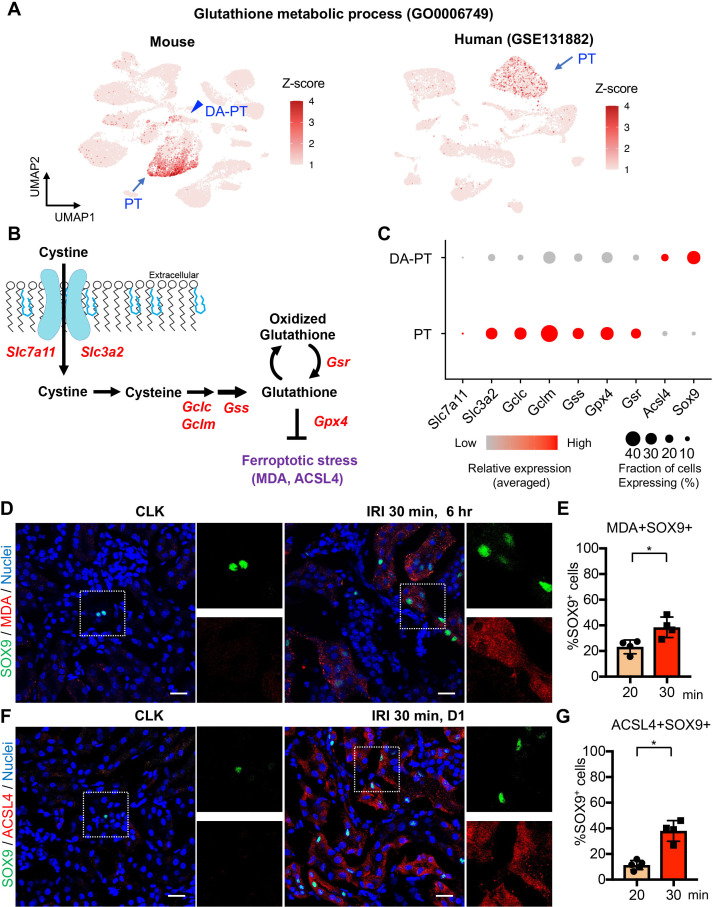
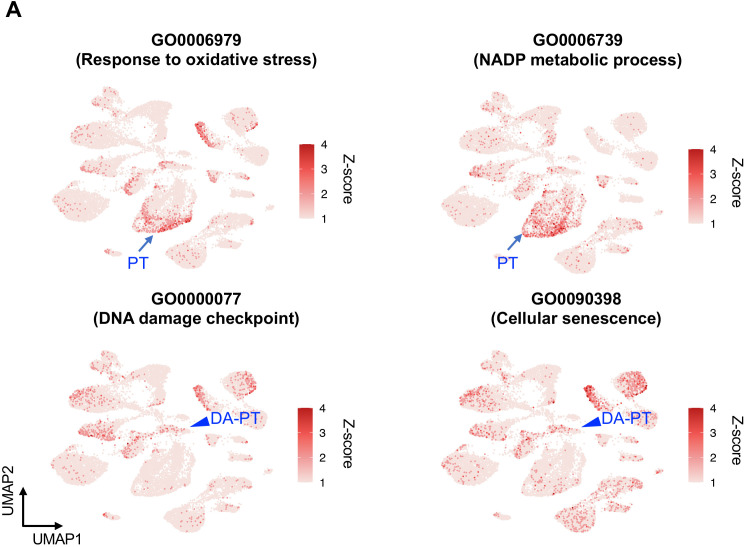
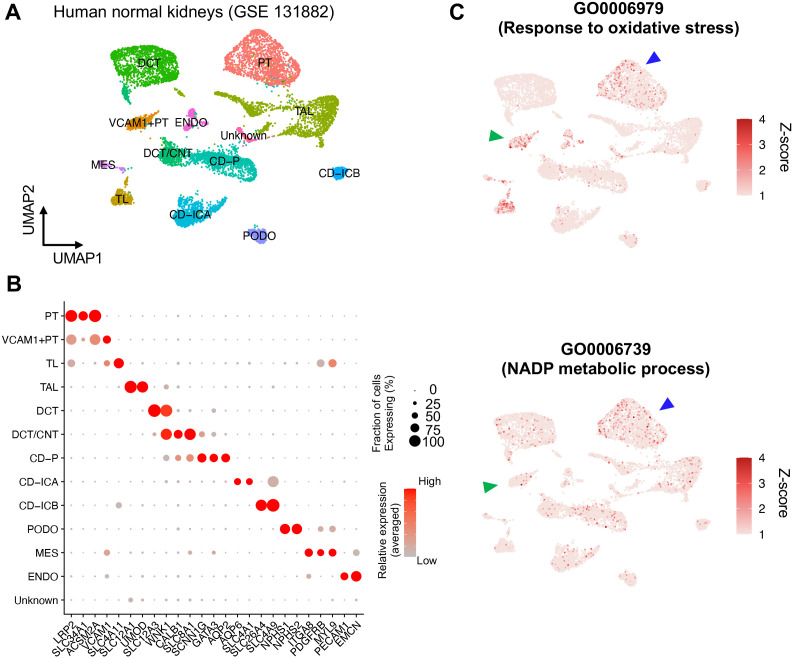
Figure 5. Damage-associated PT cells undergo high ferroptotic stress after severe IRI.
(A) UMAP rendering of glutathione metabolic process in mouse and human kidneys. (B) A scheme showing glutathione-glutathione peroxidase 4 (GPX4) anti-ferroptotic defense pathway. Slc7a11 and Slc3a2 (system xc-); Gclc and Gclm (glutamate-cysteine ligase); Gss (glutathione synthetase); Gsr (glutathione reductase): and Gpx4. MDA (malondialdehyde, a lipid peroxidation product) and ACSL4 (acyl-CoA synthetase long-chain family member 4) are markers for ferroptotic stress. (C) Dot plots show the expression of genes for glutathione-GPX4 axis, Sox9, and Acsl4. (D) Immunostaining for SOX9 and MDA (6 hr post-IRI), and (E) quantification of double-positive cells in total SOX9+ cells. N = 4. (F) Immunostaining for SOX9 and ACSL4 (1 day post-IRI), and (G) quantification of double-positive cells in total SOX9+ cells. N = 4. Insets: individual fluorescence channels of the dotted box area. Note that severe ischemia (30 min) induces more ferroptotic stress markers (MDA and ACSL4) in SOX9+ cells in damaged kidneys than mild ischemia (20 min). Wild-type C57BL/6J mice were used for (D) to (G). Scale bars, 20 μm in (D) and (F). *p < 0.05. unpaired Student’s t-test.


