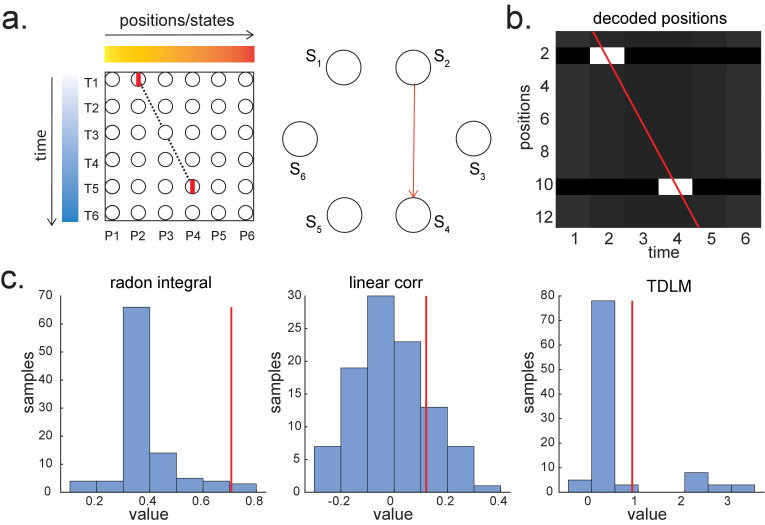
Appendix 5—figure 1. Parametric relationship between space and time vs. graph transitions.
(a) A scheme for skipping sequence (left). Both Radon and linear weighted correlation methods aim to capture a parametric relationship between space and time. Temporal delayed linear modelling (TDLM), on the other hand, tries to capture transitions in a graph (shown in right, with the red indicating the transition of interest). (b) A decoded time by position matrix from simulated spiking data. (c) Replay analysis using all three methods. TDLM is less sensitive compared to existing ‘line search’ methods, like radon or linear correlation. The red line indicates the true sequence measure from each of these methods. The bar plots are permutation samples by randomly shuffling the rate maps.

