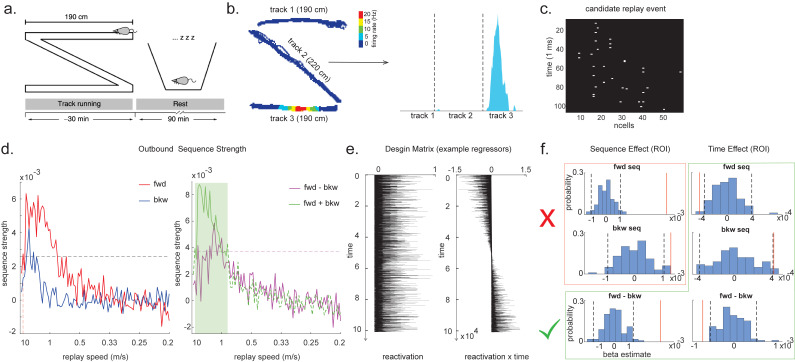
Figure 7. Temporal delayed linear modelling (TDLM) applied to real rodent data.
(a) The experimental design of Ólafsdóttir et al., 2016. Rats ran on Z maze for 30 min, followed by 90 min rest. (b) An example rate map for a place cell. The left panel shows its spatial distribution on the Z maze, and the right panel is its linearized distribution. (c) An example of a candidate replay event (spiking data). (d) Sequence strength as a function of replay speed is shown for the outbound rate map. Black dotted line is the permutation threshold after controlling for multiple comparisons. Left panel: forward sequence (red) and backward sequence (blue). The red dotted line indicates the fastest replay speed that is significant – 10 m/s. Right panel: forward–backward sequence. The pink dotted line indicates the multiple comparison-corrected permutation threshold for the replay difference. The green line is the sum of sequence strength between forward and backward direction. The solid line (with green shading) indicates the significant replay speeds (0.88–10 m/s) after controlling for multiple comparisons. We use this as a region of interest (ROI) to test for time-varying effect on replay in (f). (e) Illustration of two exemplar regressors in the design matrix for assessing time effect on replay strength. The ‘reactivation’ regressor is a lagged copy of reactivation strength of given position and is used to obtain sequence effect. The ‘reactivation × time’ regressor is the element-wise multiplication between this position reactivation and time (z-scored); it explicitly models the effect of time on sequence strength. Both regressors are demeaned. (f) Beta estimate of the sequence effect (left panel), as well as time modulation effect on sequence (right panel) in the ROI, is shown. Negative value indicates replay strength decreases over time, while positive value means replay increases as a function of sleep time. The statistical inference is done based on a permutation test. The two black dotted lines in each panel indicate the 2.5th and 97.5th percentile of the permutation samples, respectively. The red solid line indicates the true beta estimate of the effect. Note that there is a selection bias in performing statistical inference on forward and backward sequence strength (red rectangle) within this ROI, given the sum of forward and backward sequence is correlated with either forward or backward sequence alone. There is no selection bias in performing statistics on the difference of sequence effects or effects relating to time (green rectangle).

