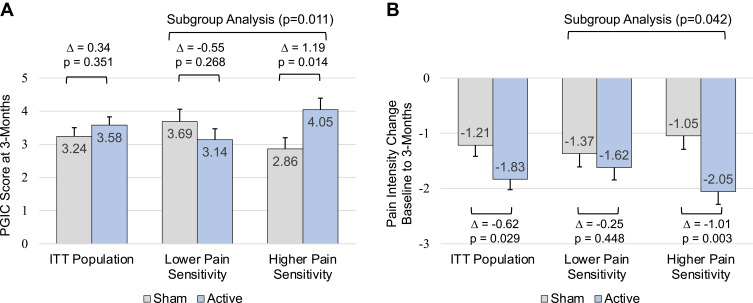
Figure 3.
Comparisons of PGIC scores at 3-months (A). Comparisons of baseline to 3-month change scores in pain intensity (FIQR pain item) (B). Error bars indicate SE. Δ, treatment effect (Active - Sham). Treatment comparisons based on MMRM analyses of ITT population and of the lower and higher pain sensitivity subgroups. Subgroup analysis p-value is for the treatment by pain sensitivity interaction term in the subgroup MMRM model.
Abbreviations: PGIC, Patient Global Impression of Change; FIQR, Fibromyalgia Impact Questionnaire Revised; ITT, intention-to-treat; MMRM, mixed model for repeated measures; SE, standard error.

